The Hard'ack Technology Environmental Monitor2020-01-27Richard Heurtley richard@heurtley.com
IntroductionThis article is about a gas sensing assembly I built for the University of Vermont (UVM) Extension to be installed in a barn. The environmental monitor calculates parts-per-million (ppm) values for:
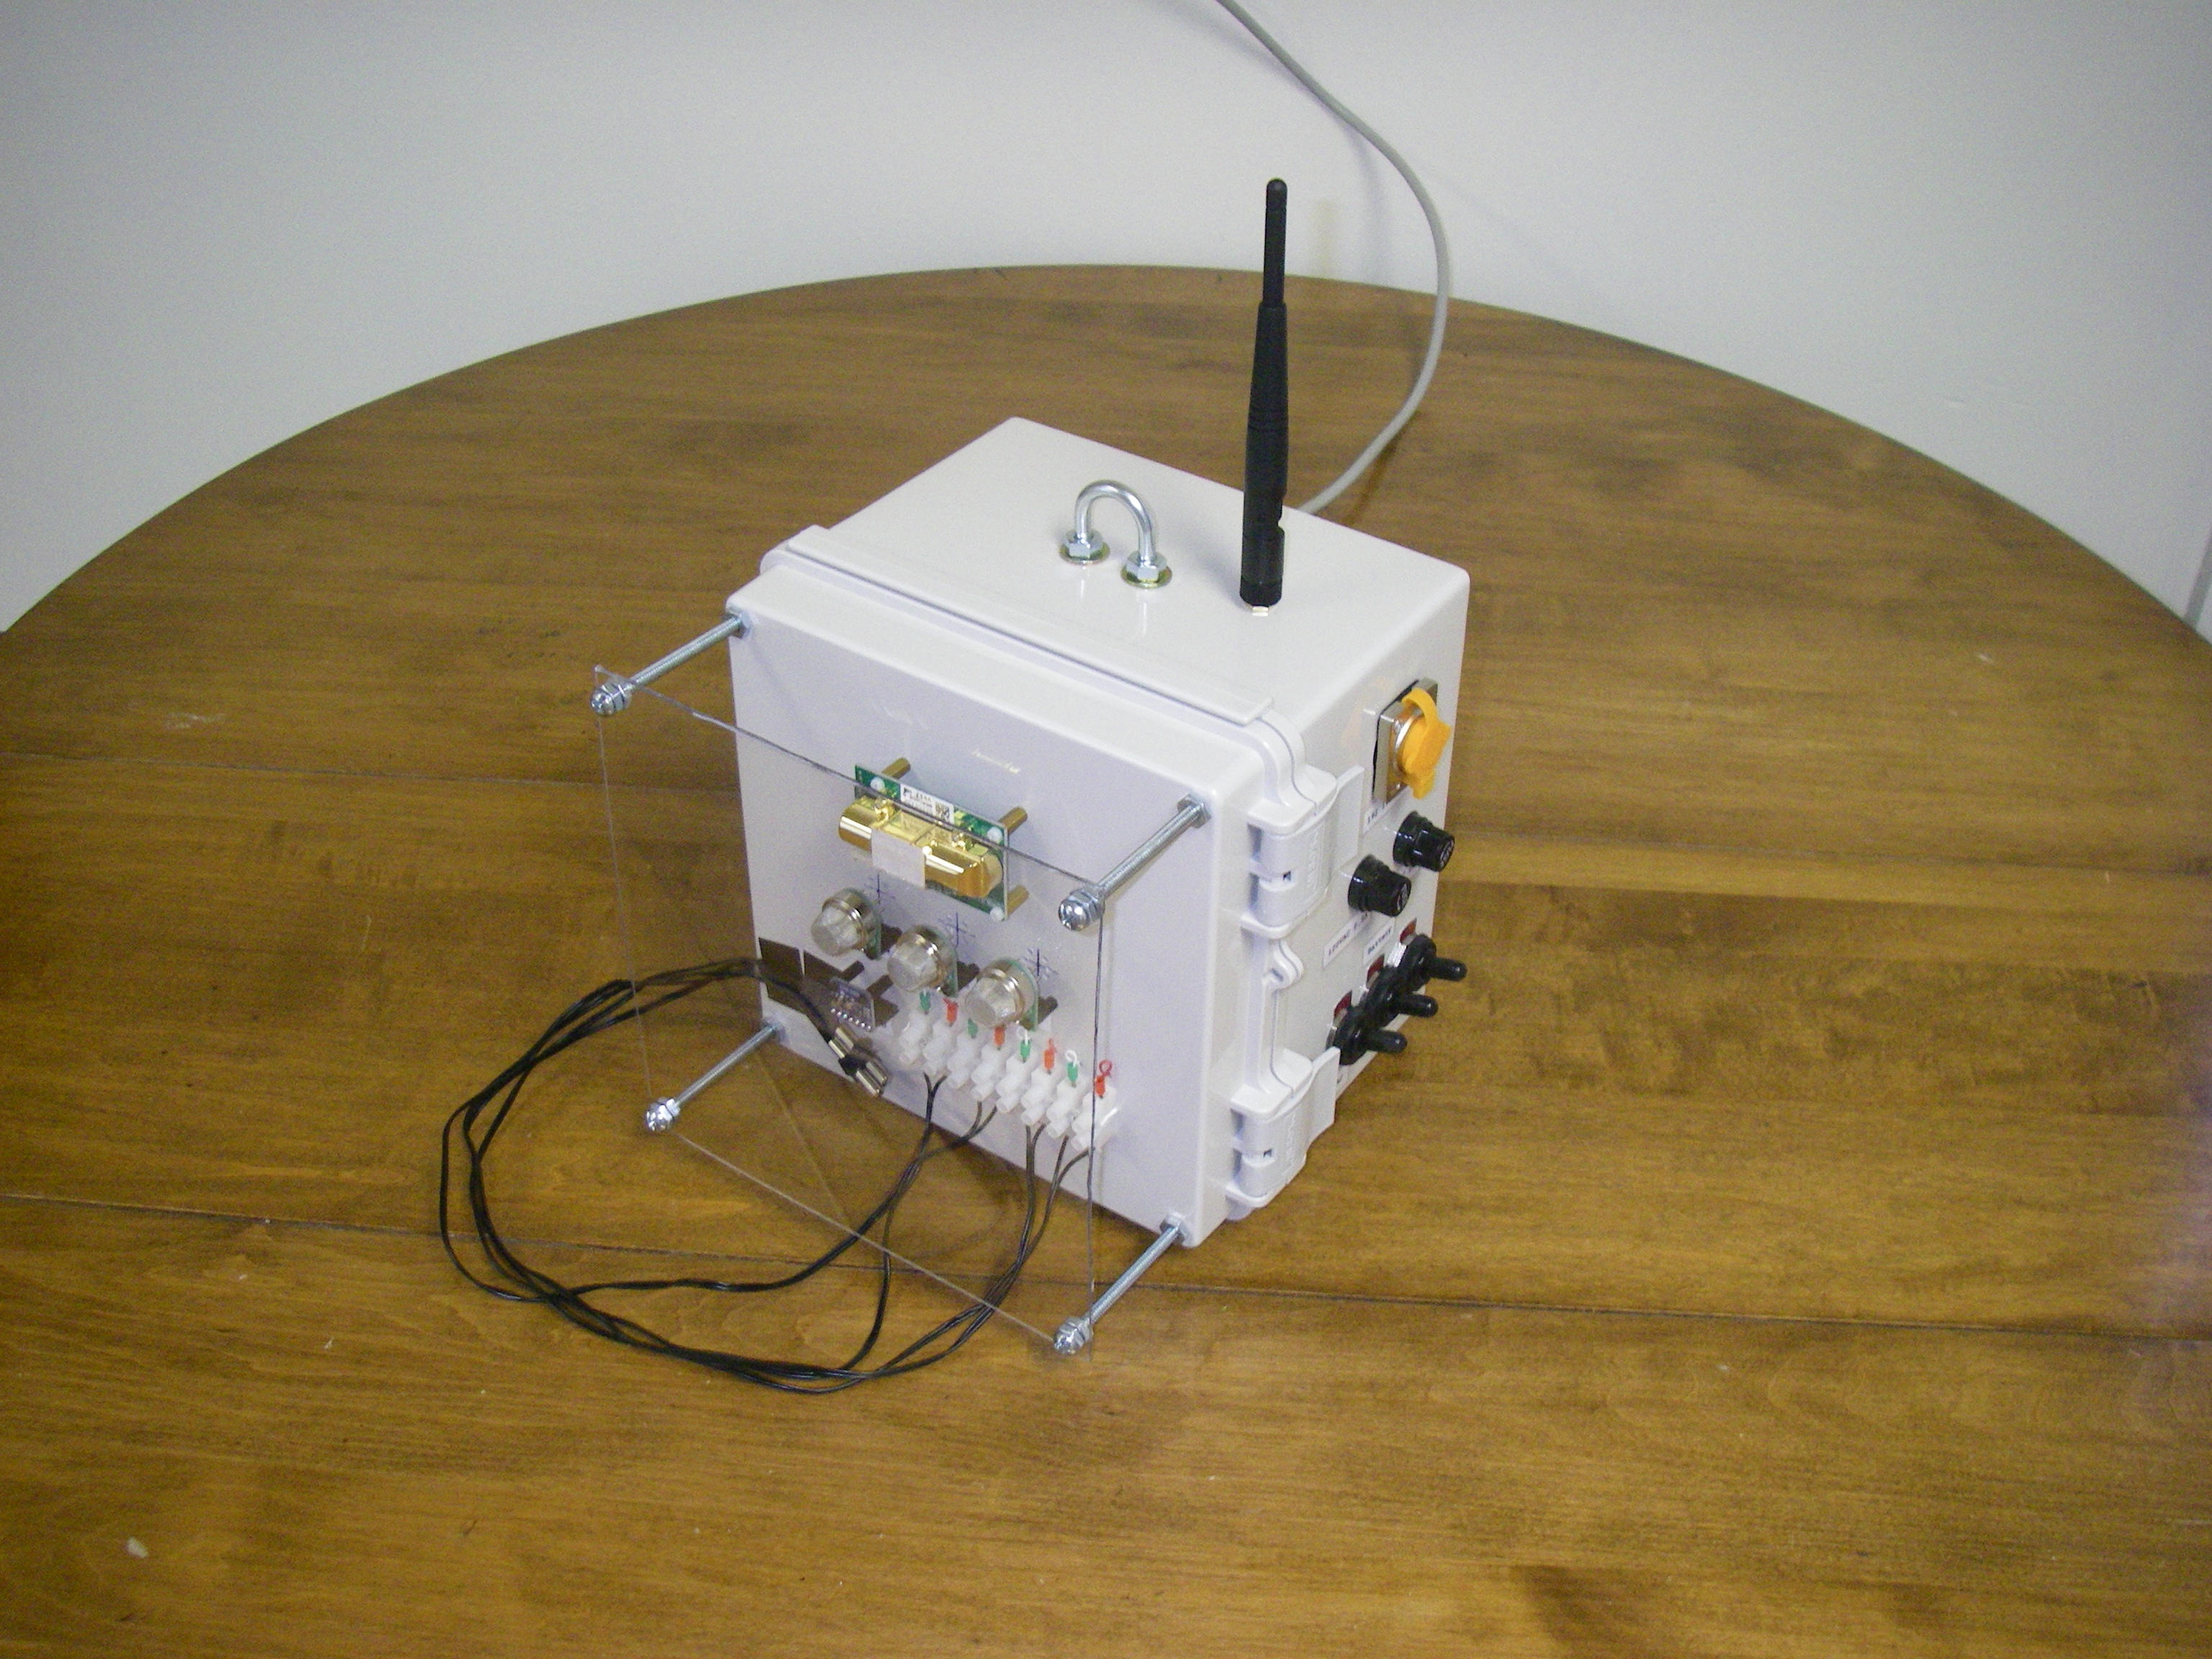
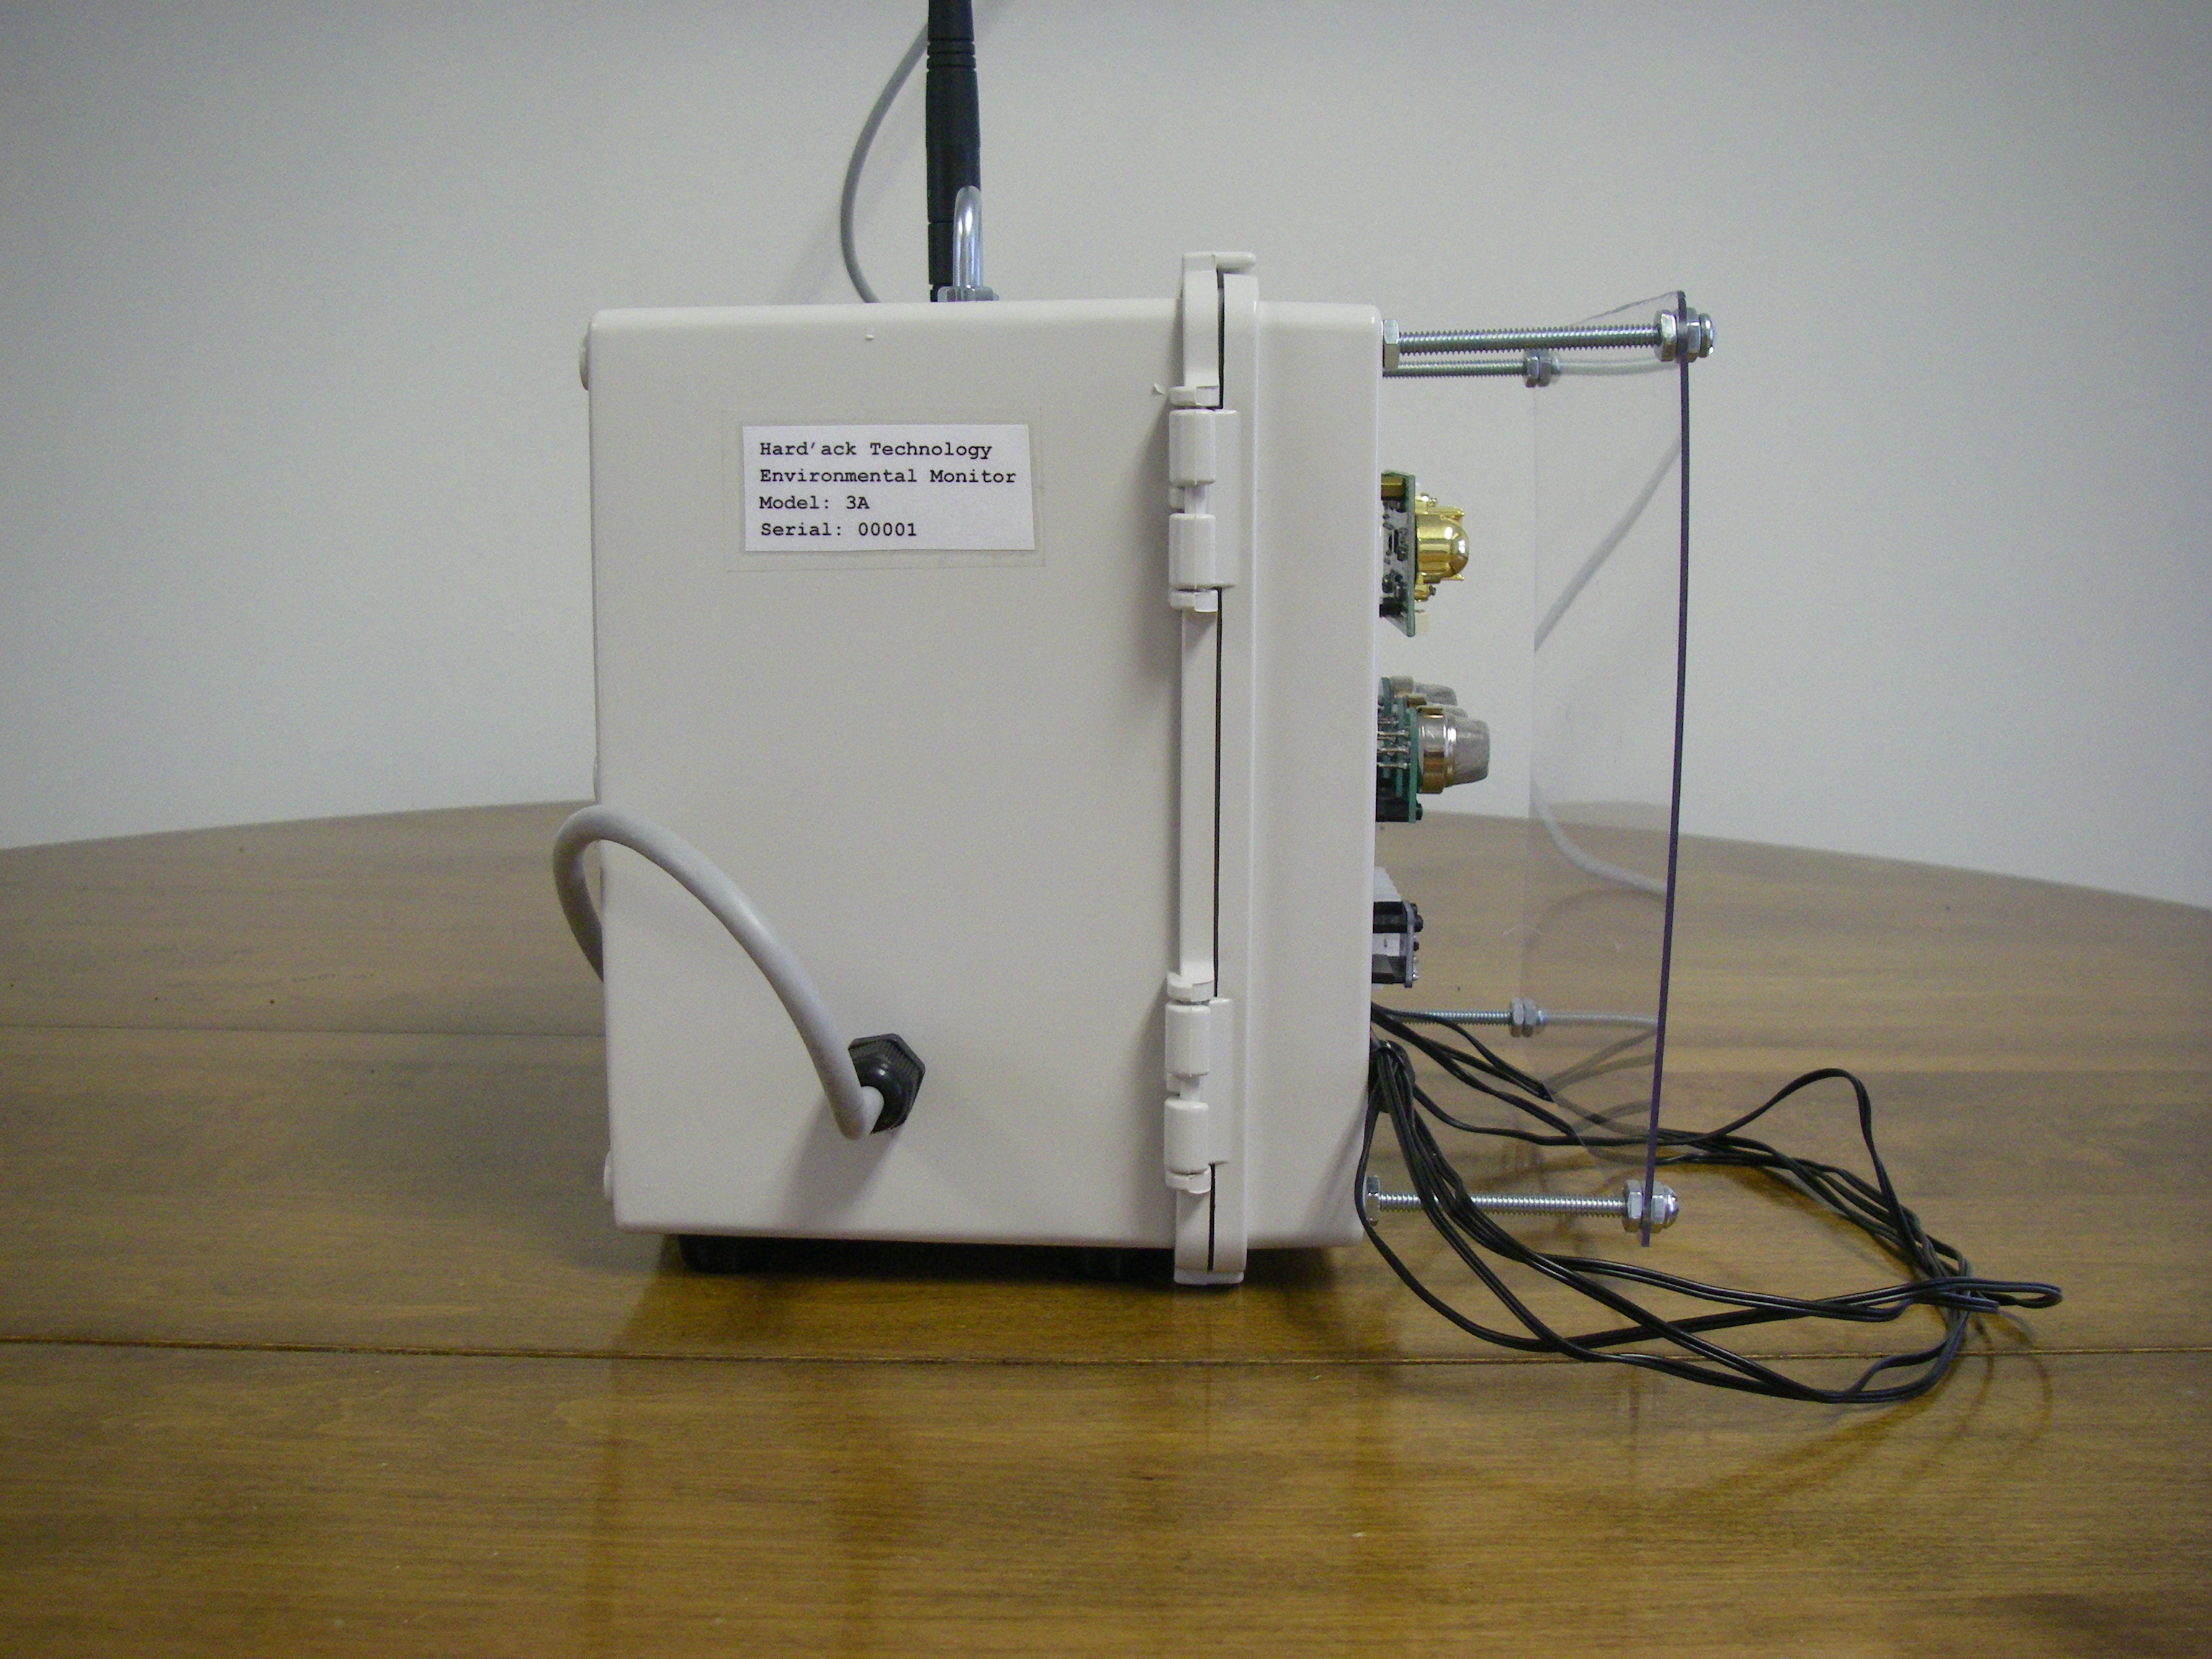
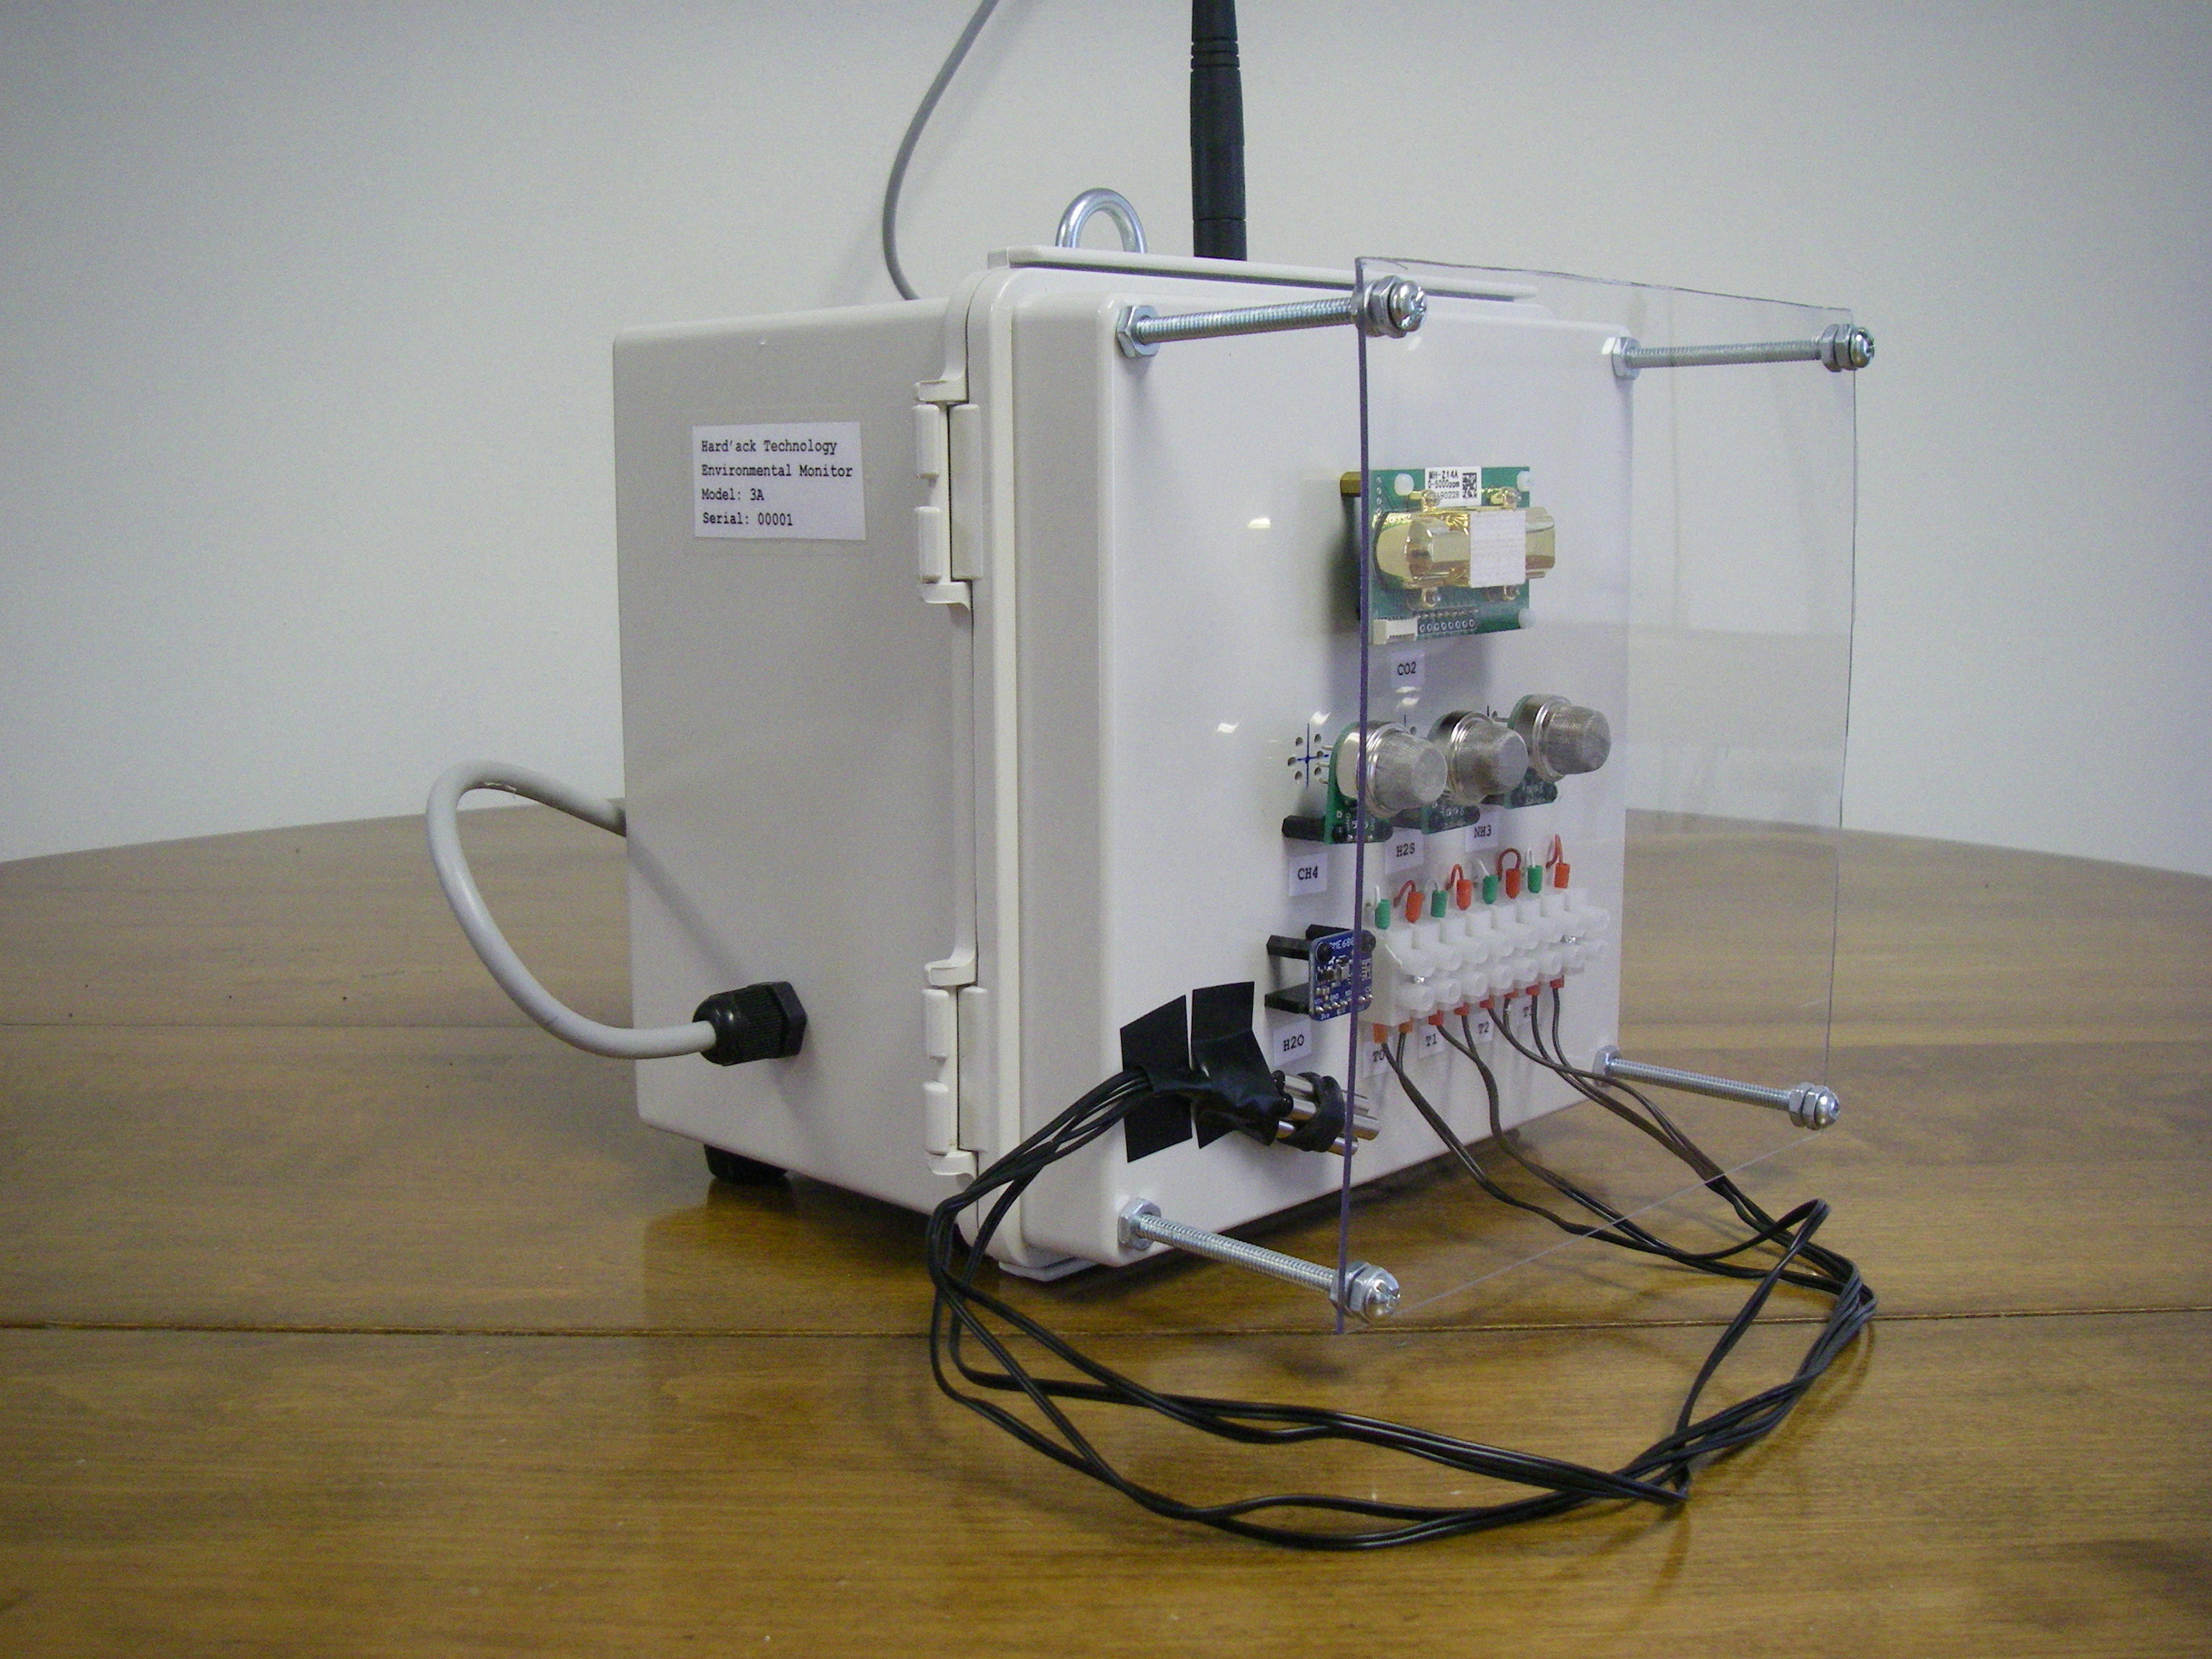
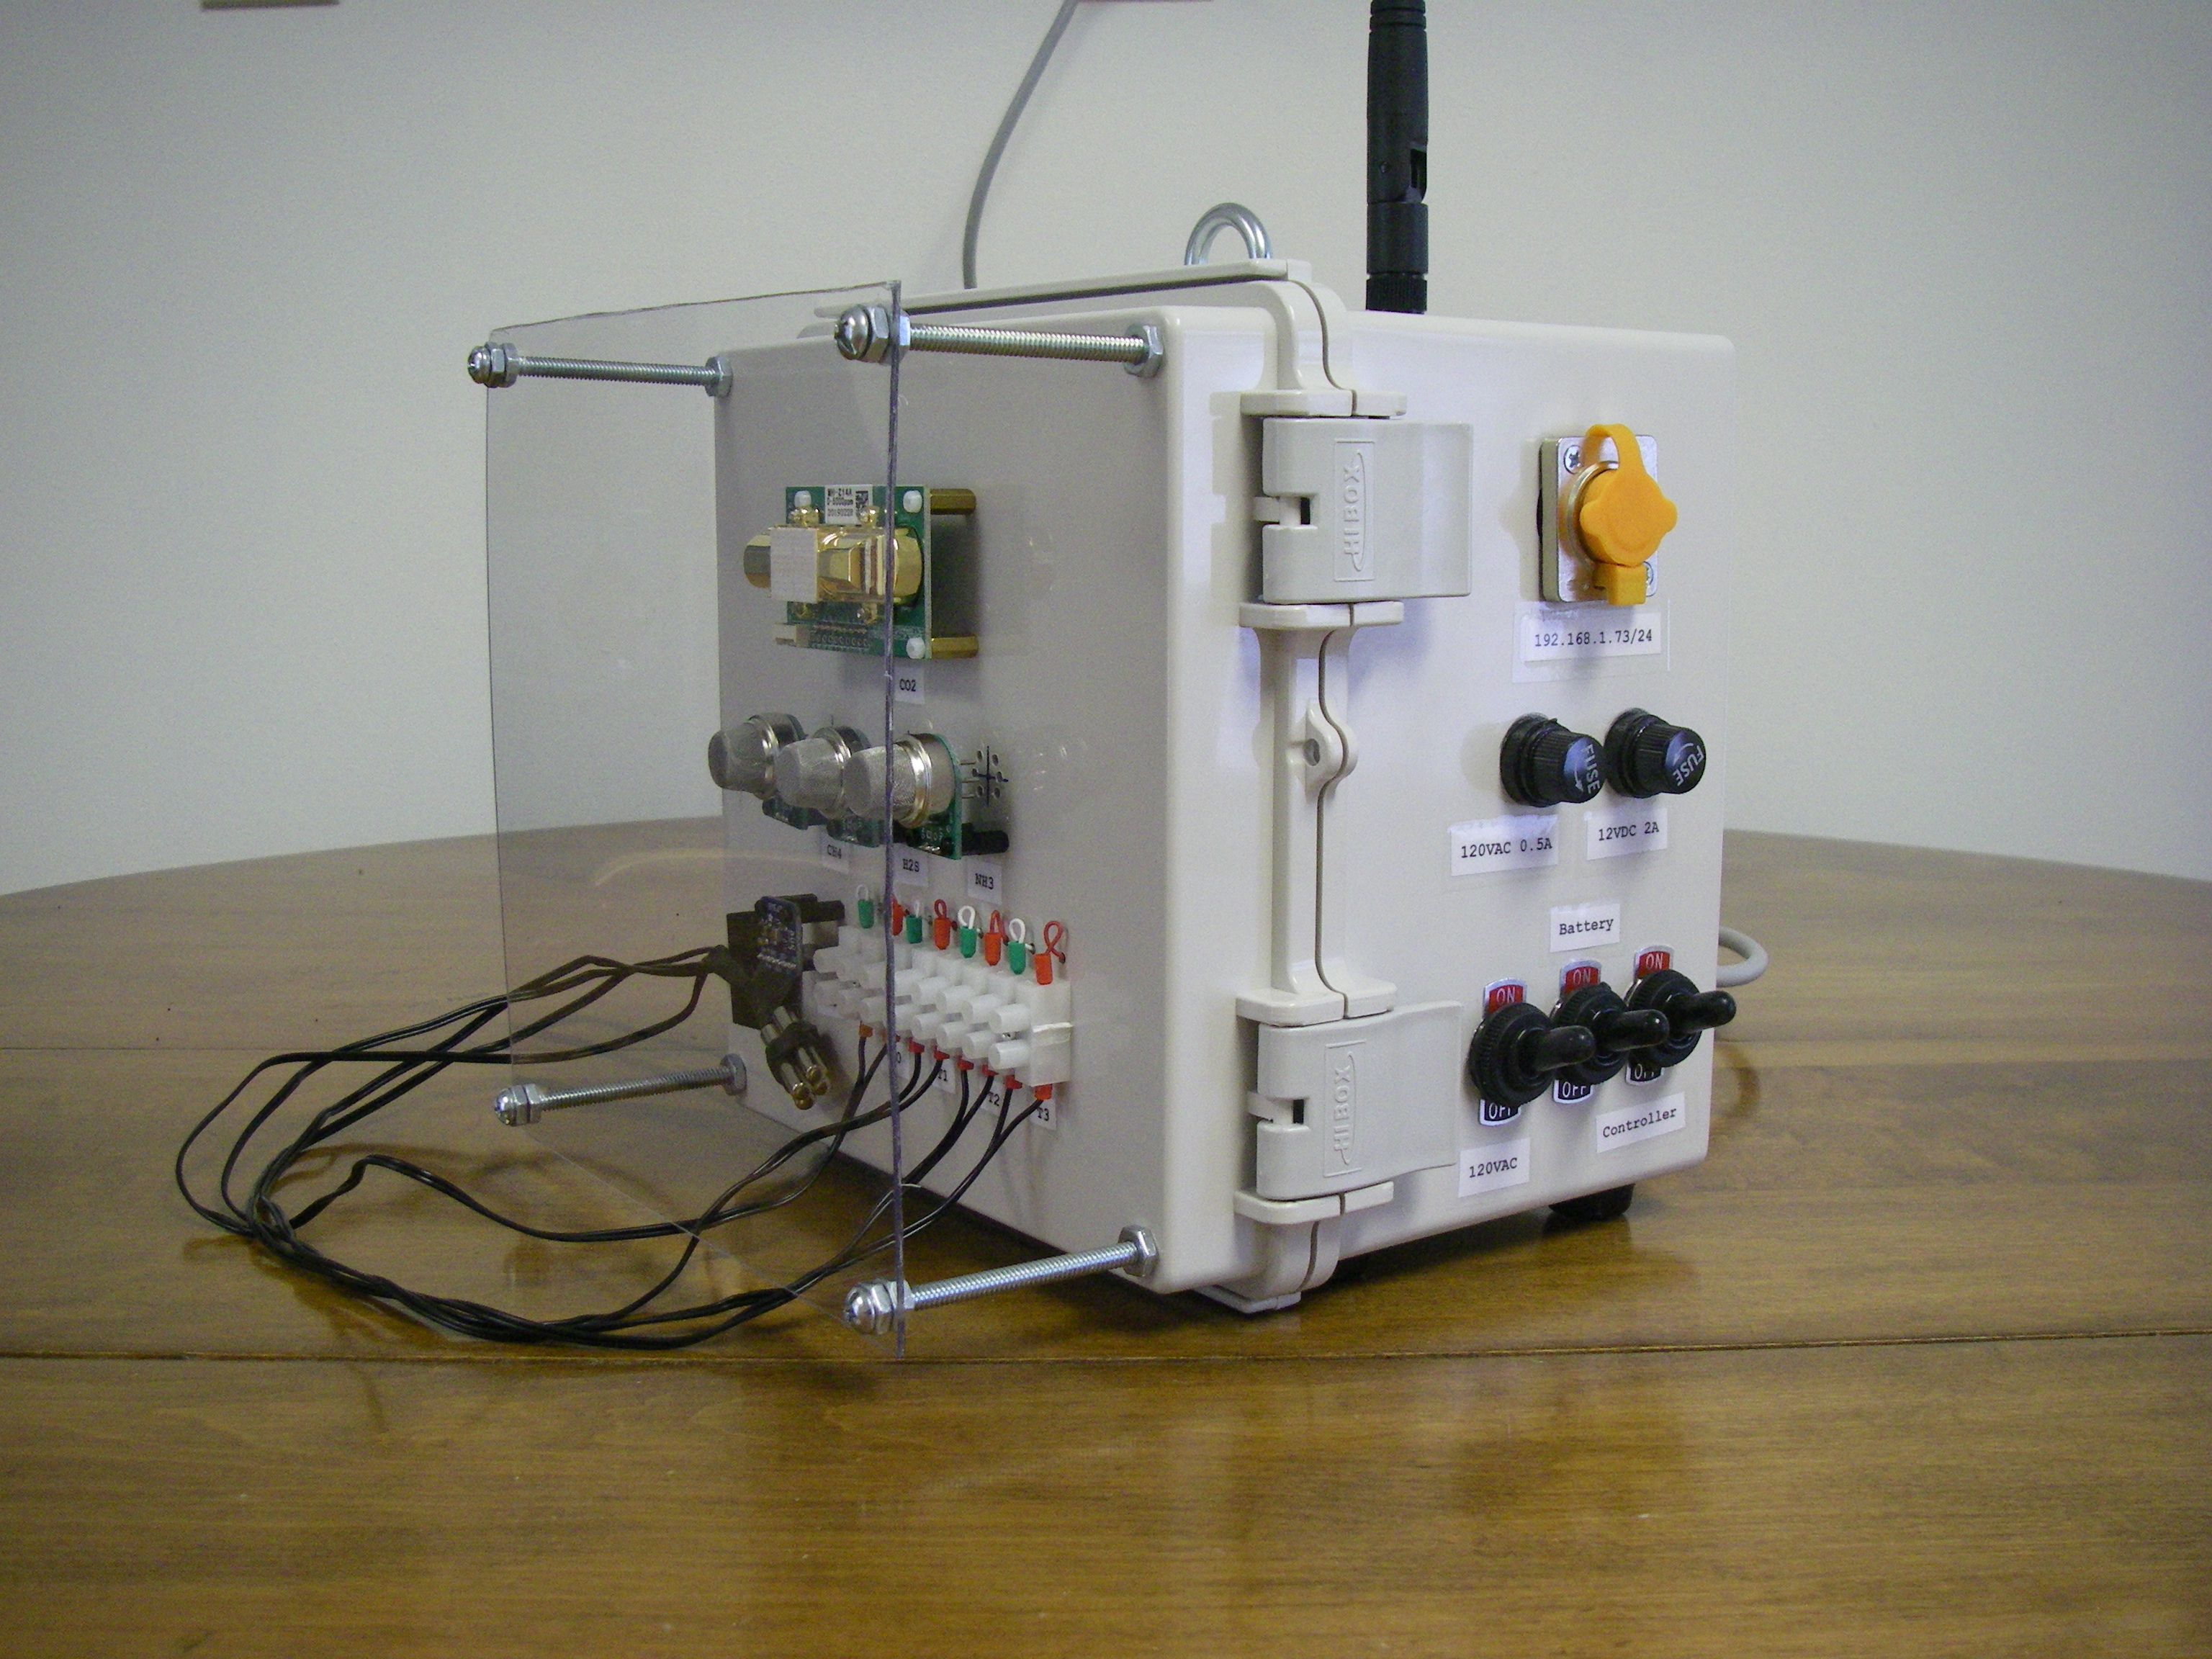
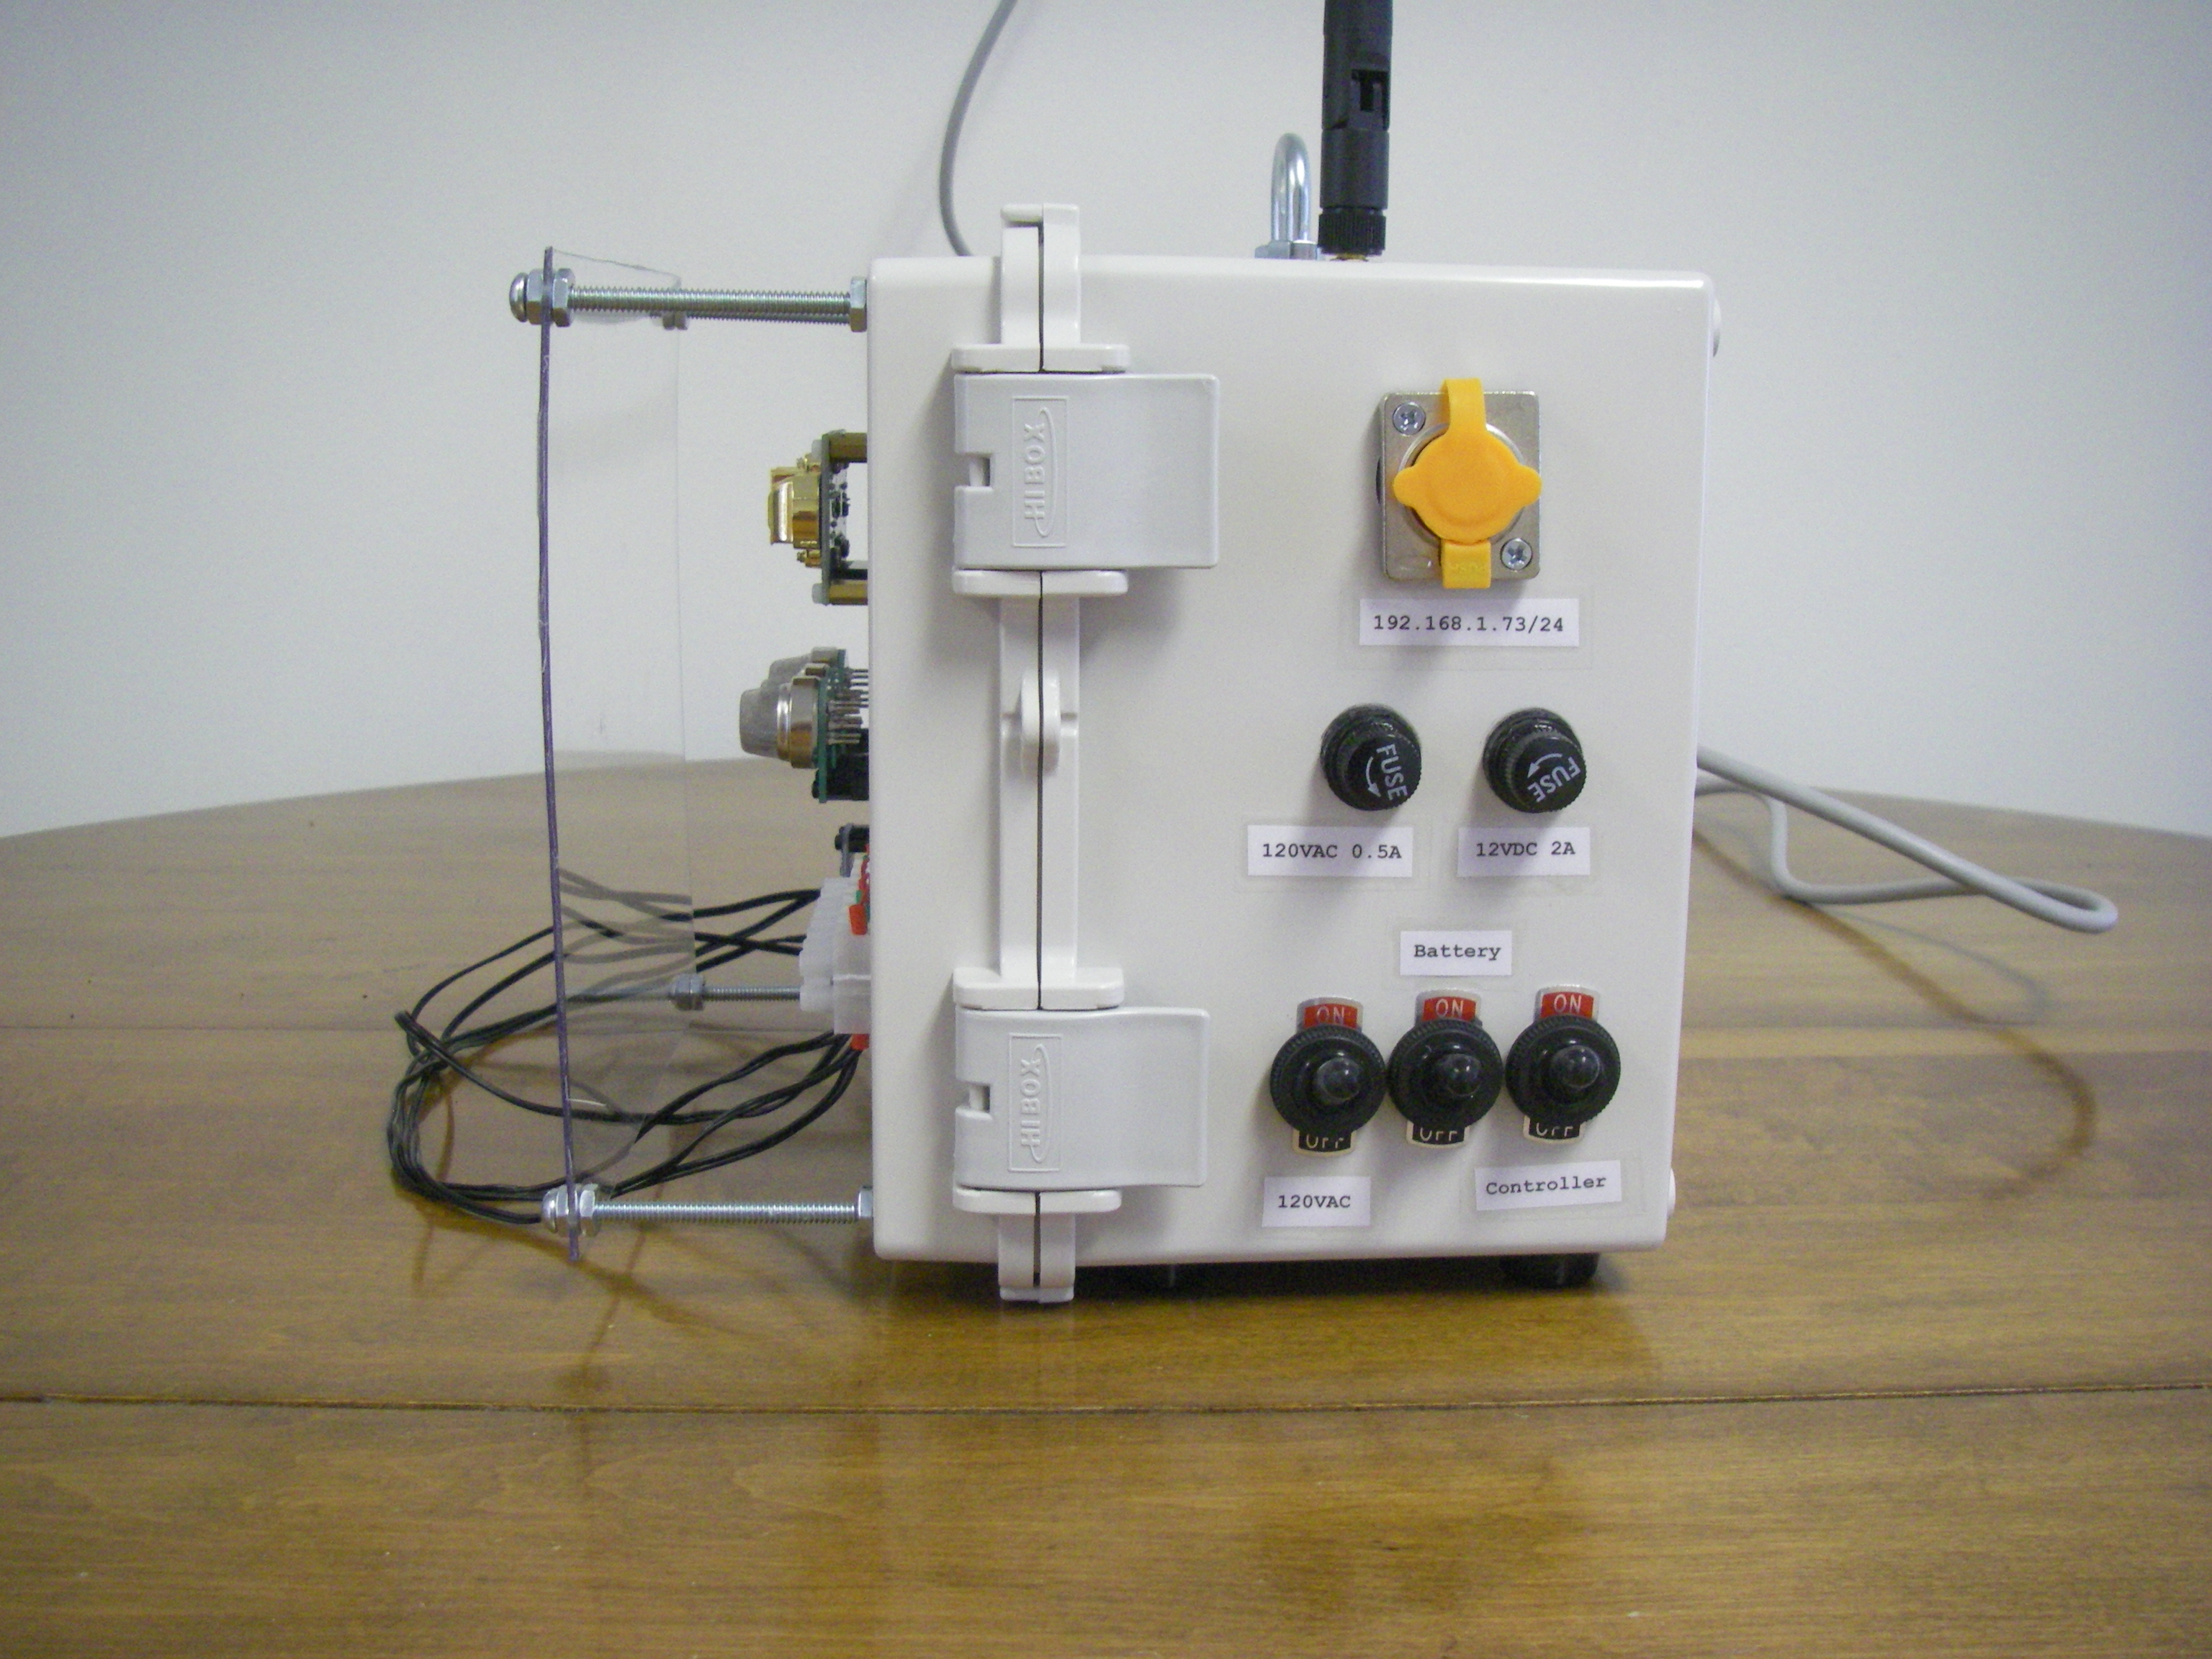
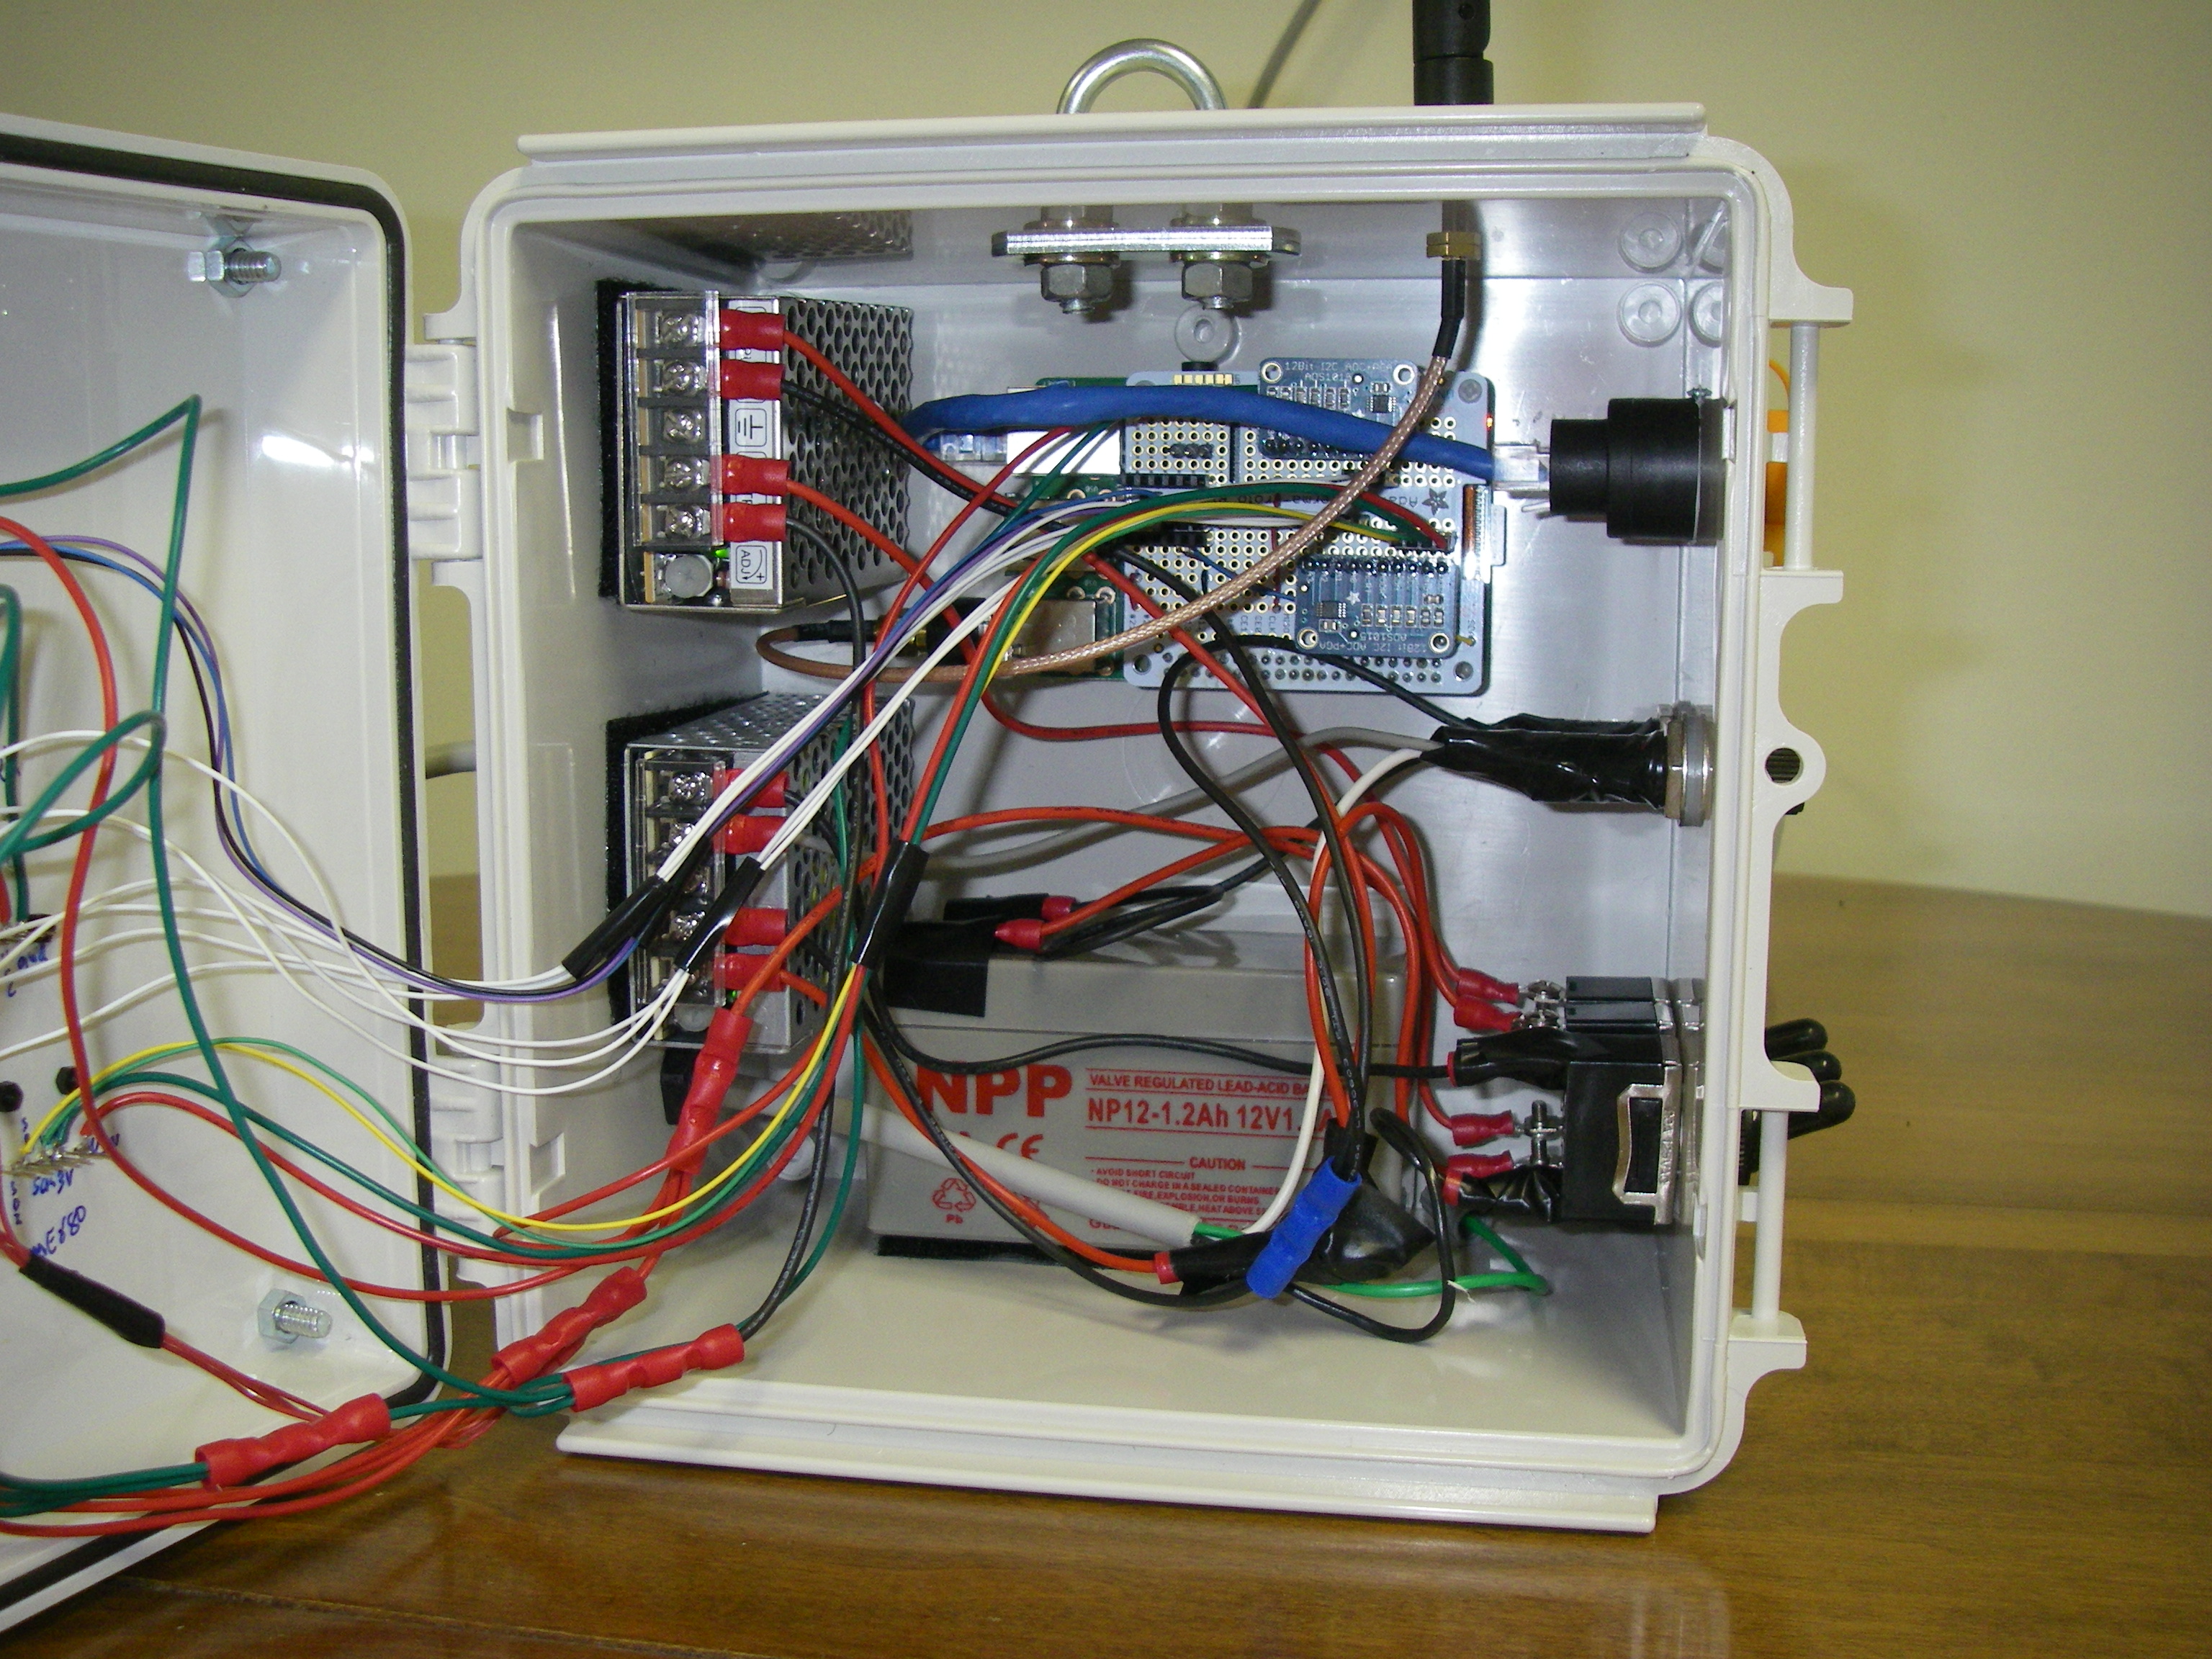
Results are stored in a database and are also available in real-time over the Internet. PicturesHere are some pictures of the completed assembly. It is 9" tall not including the WiFi antenna, 8.5" wide, 8.5" deep including the splash shield, and weighs 4.75 pounds. Click on a small picture to produce a large picture:
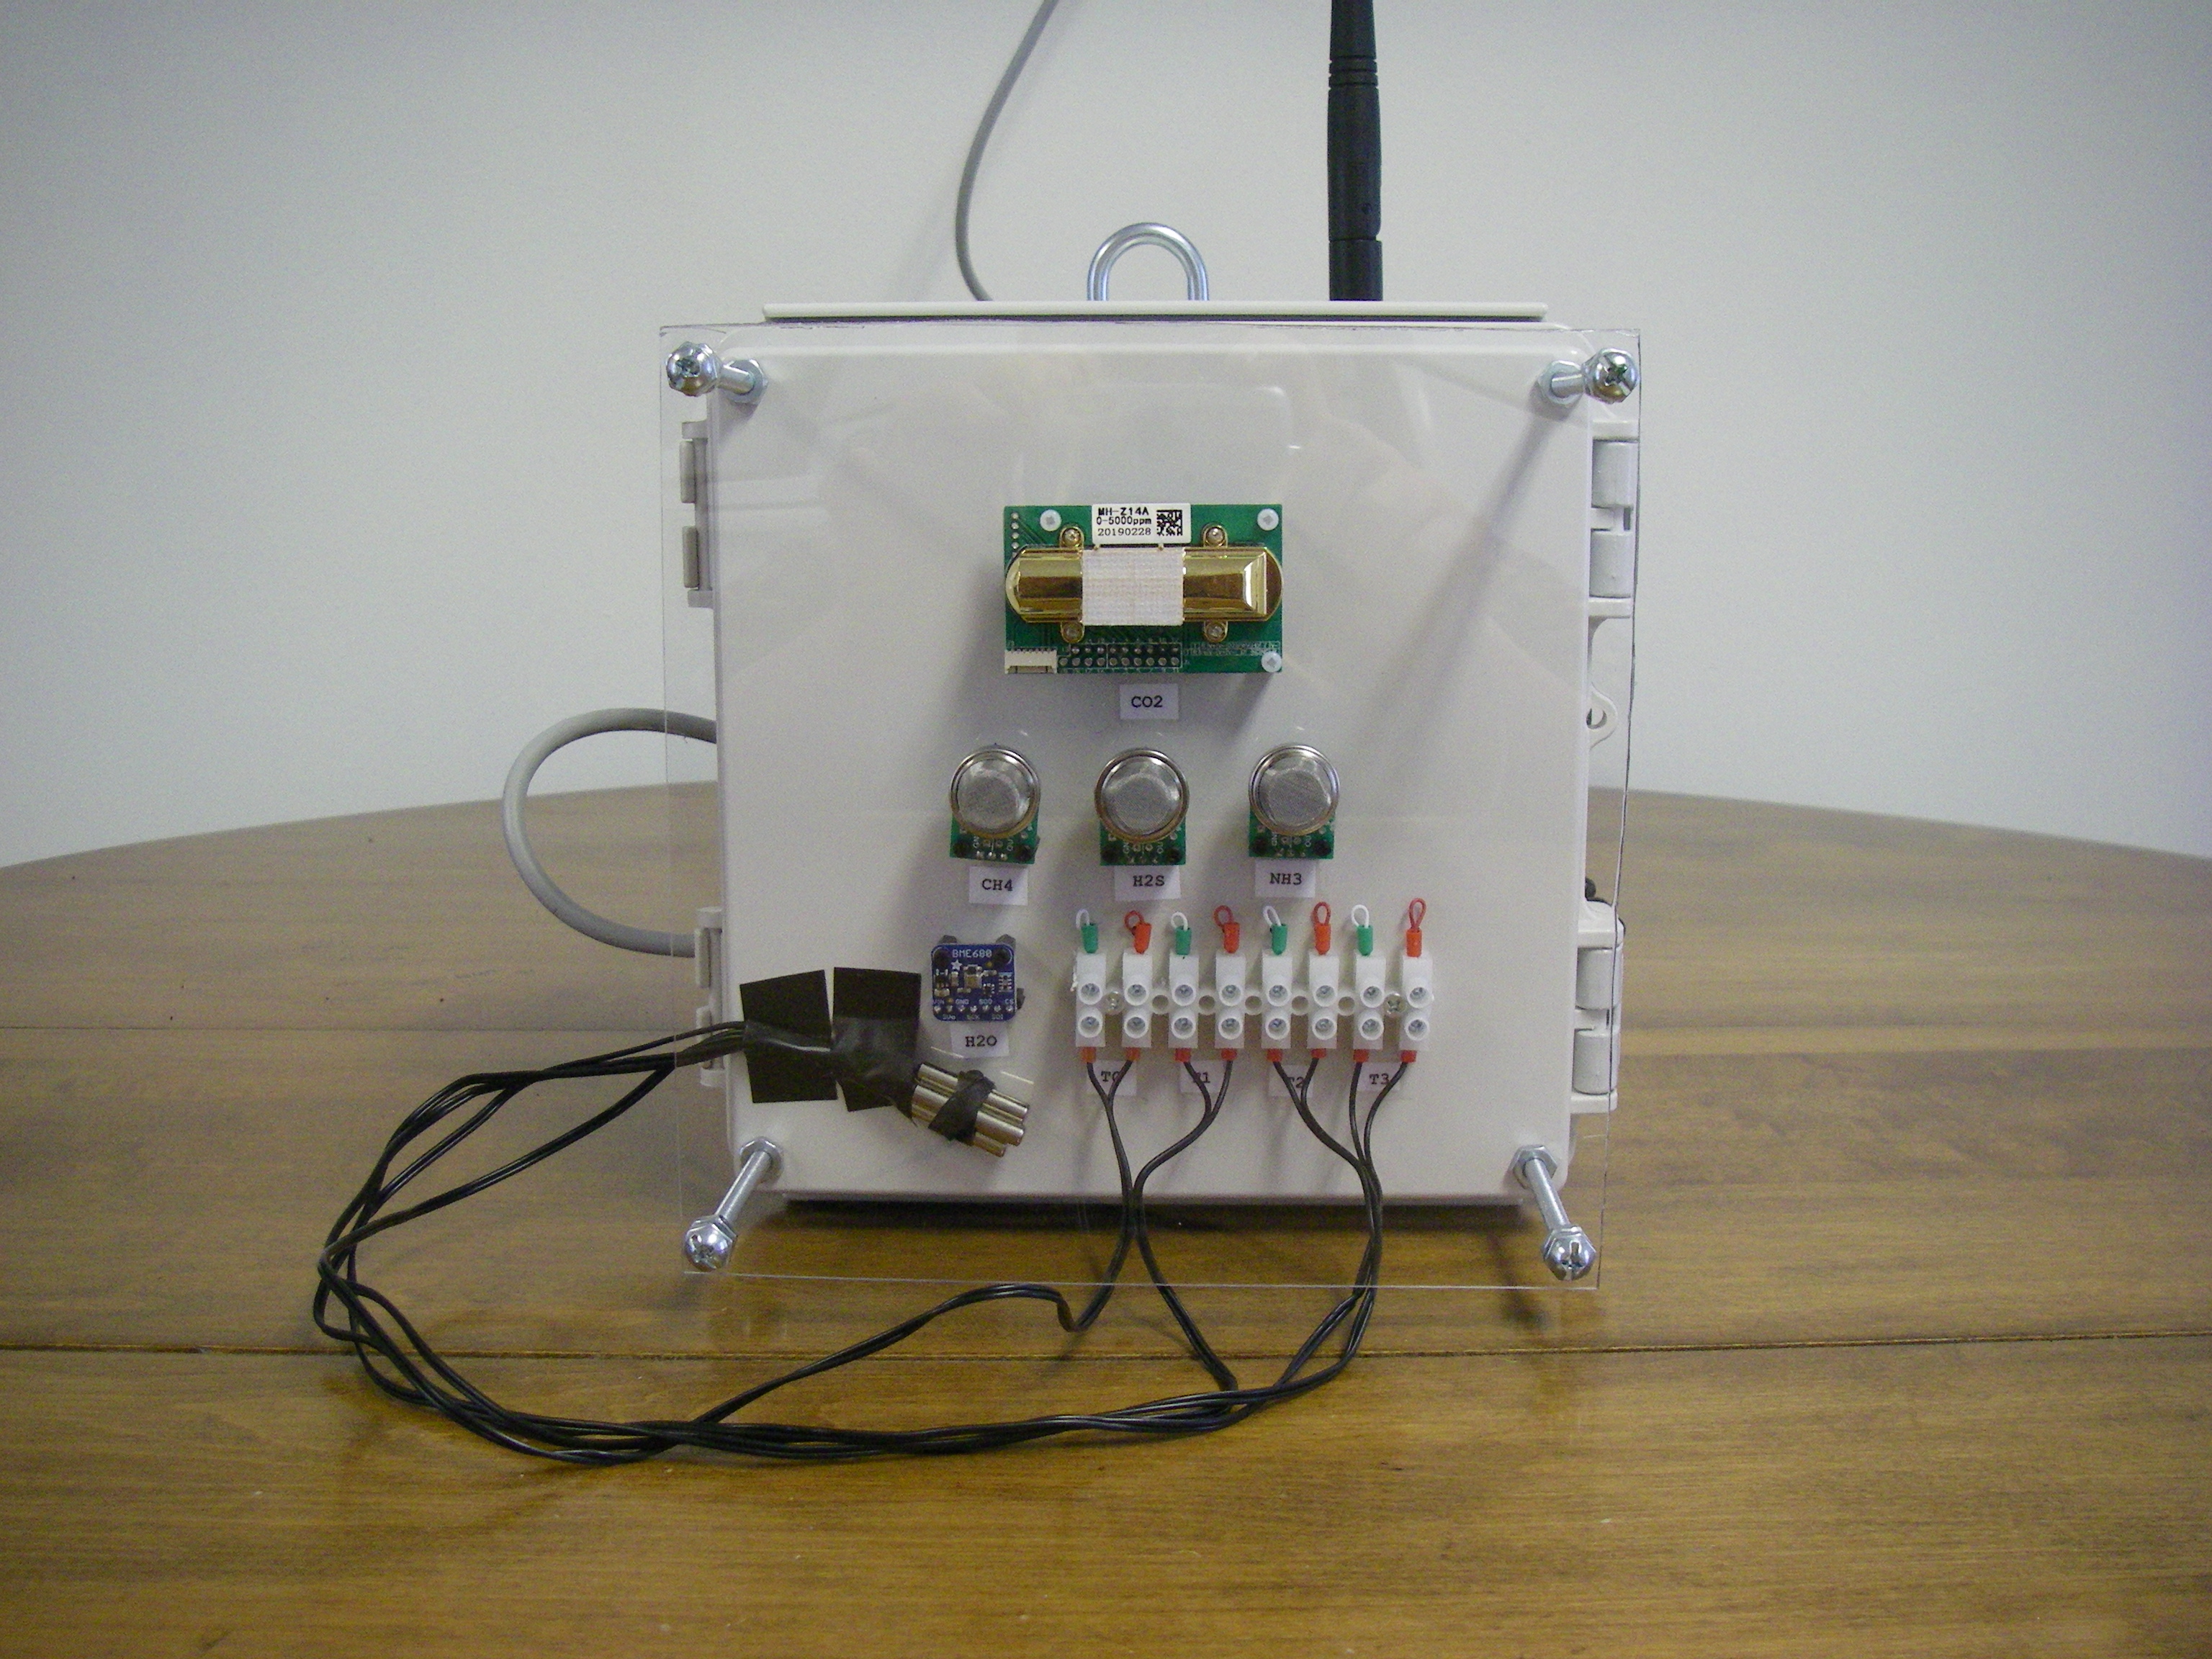
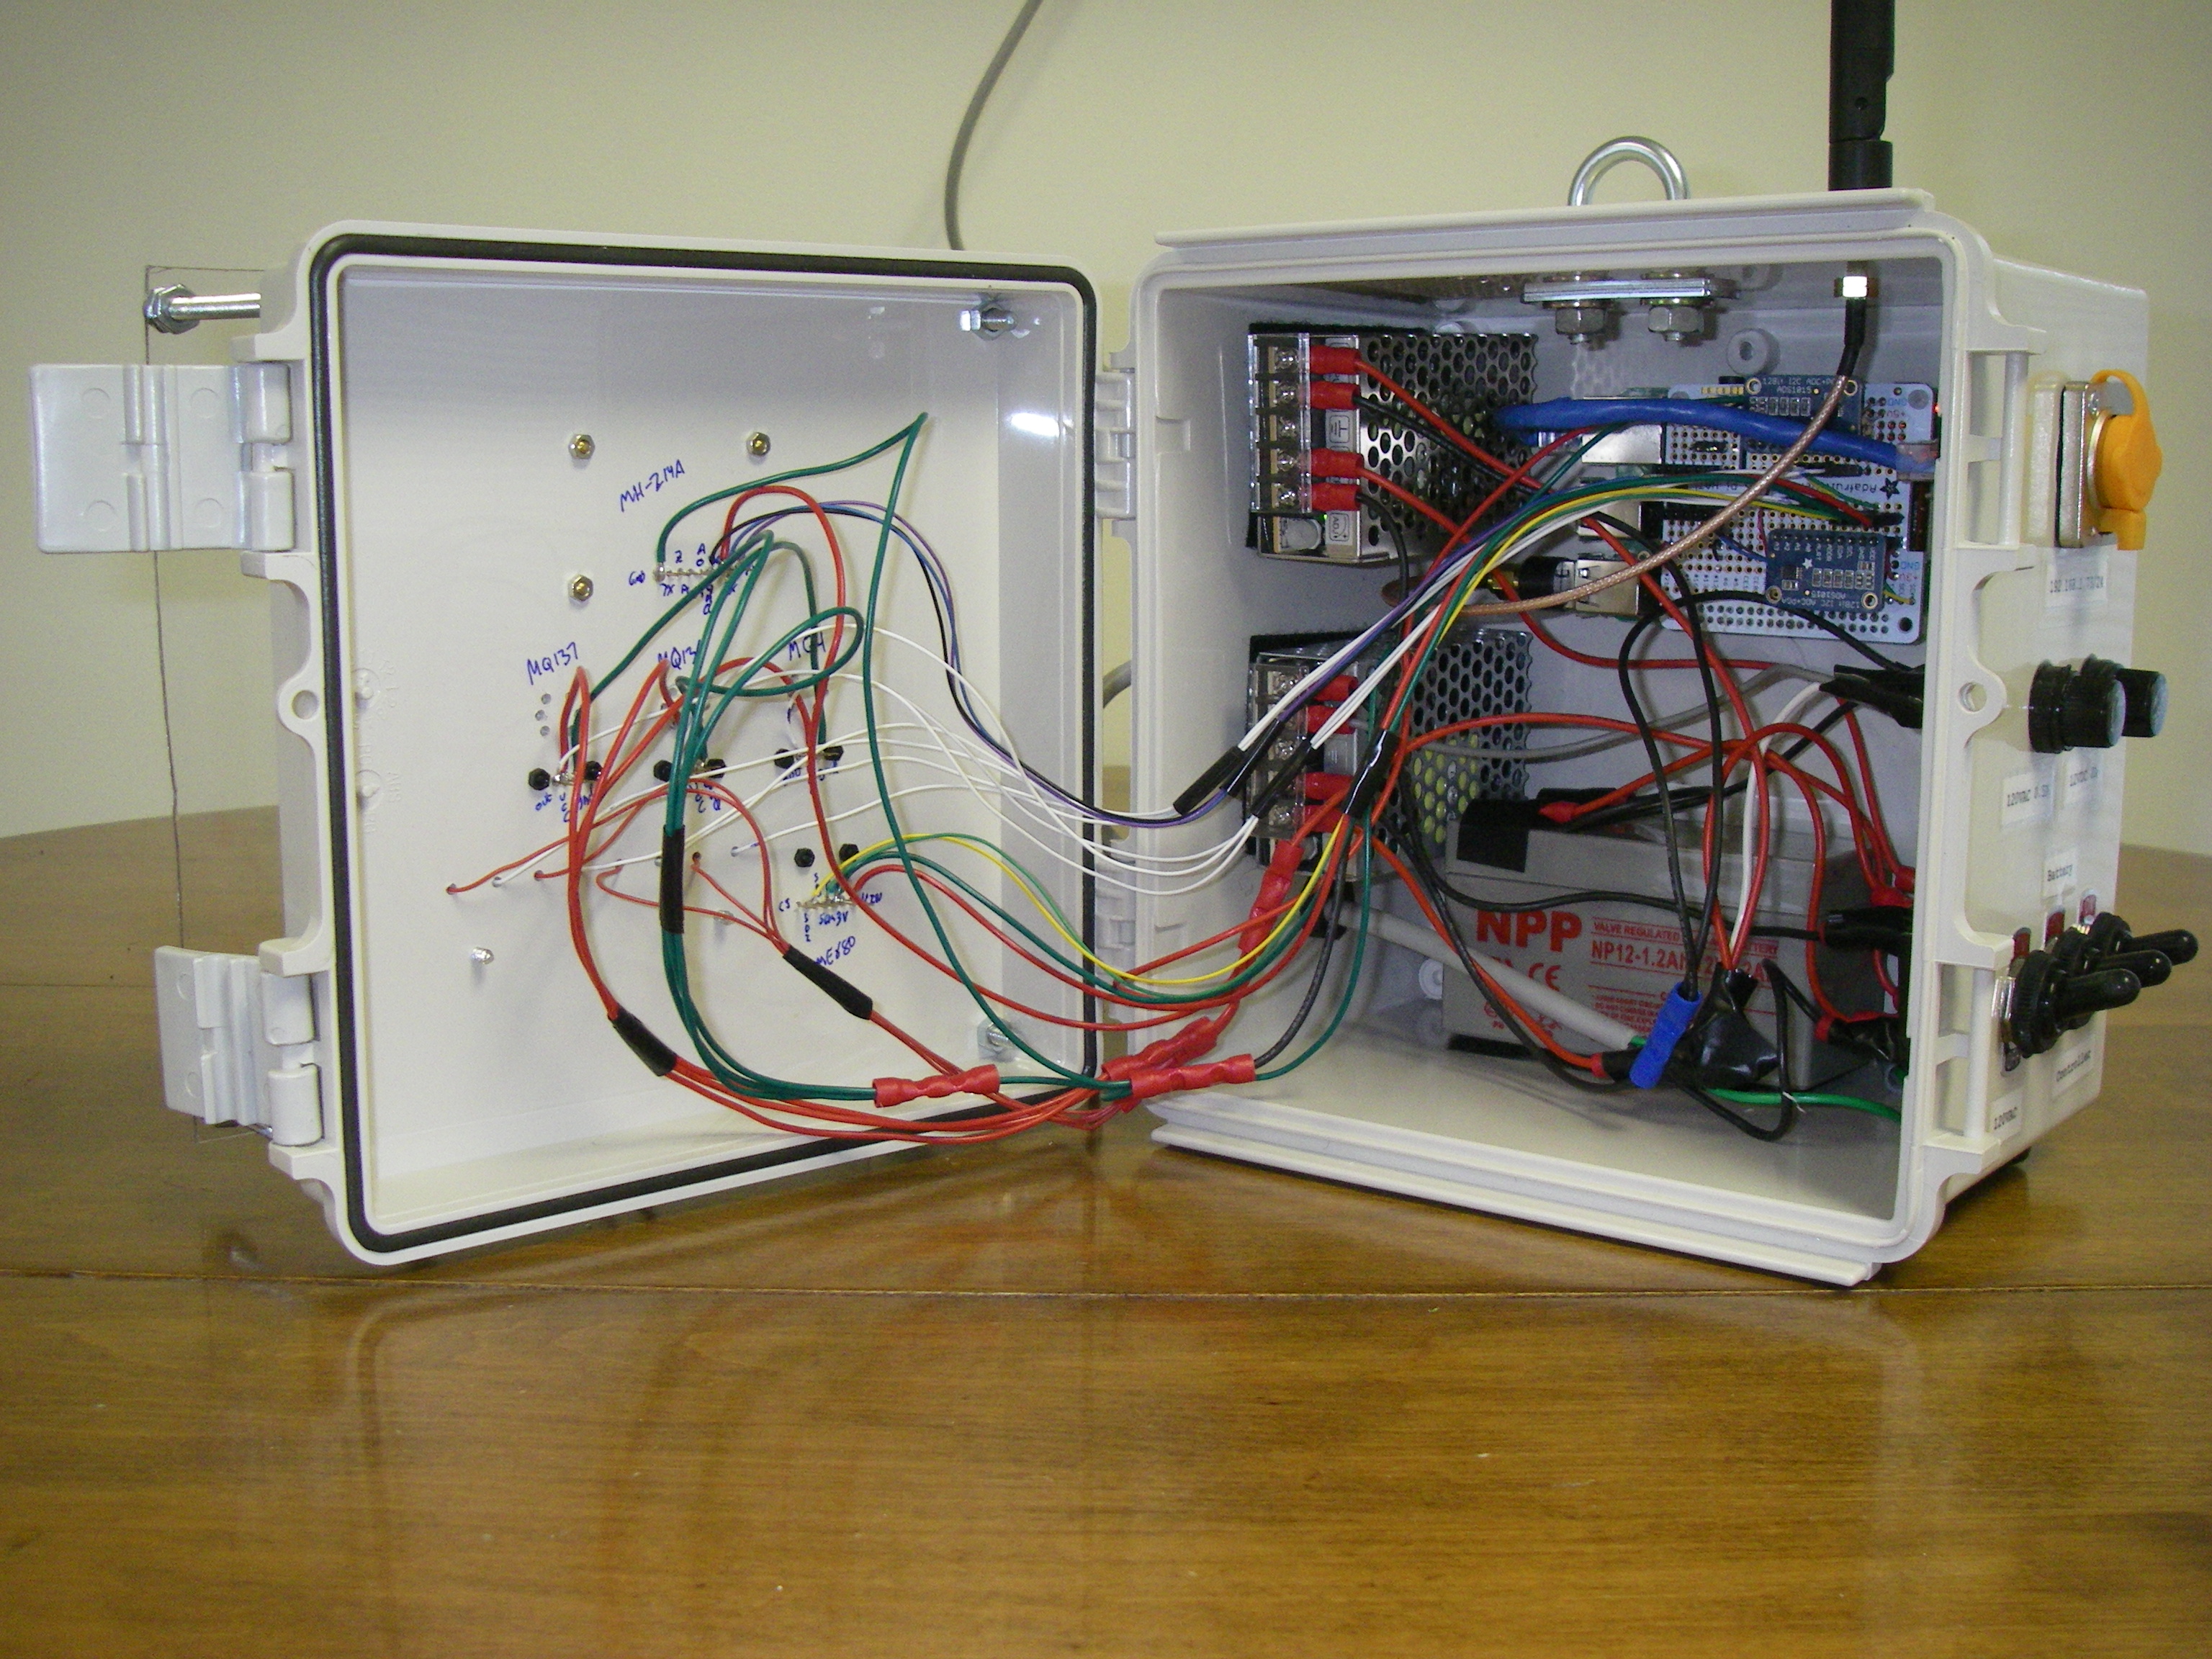
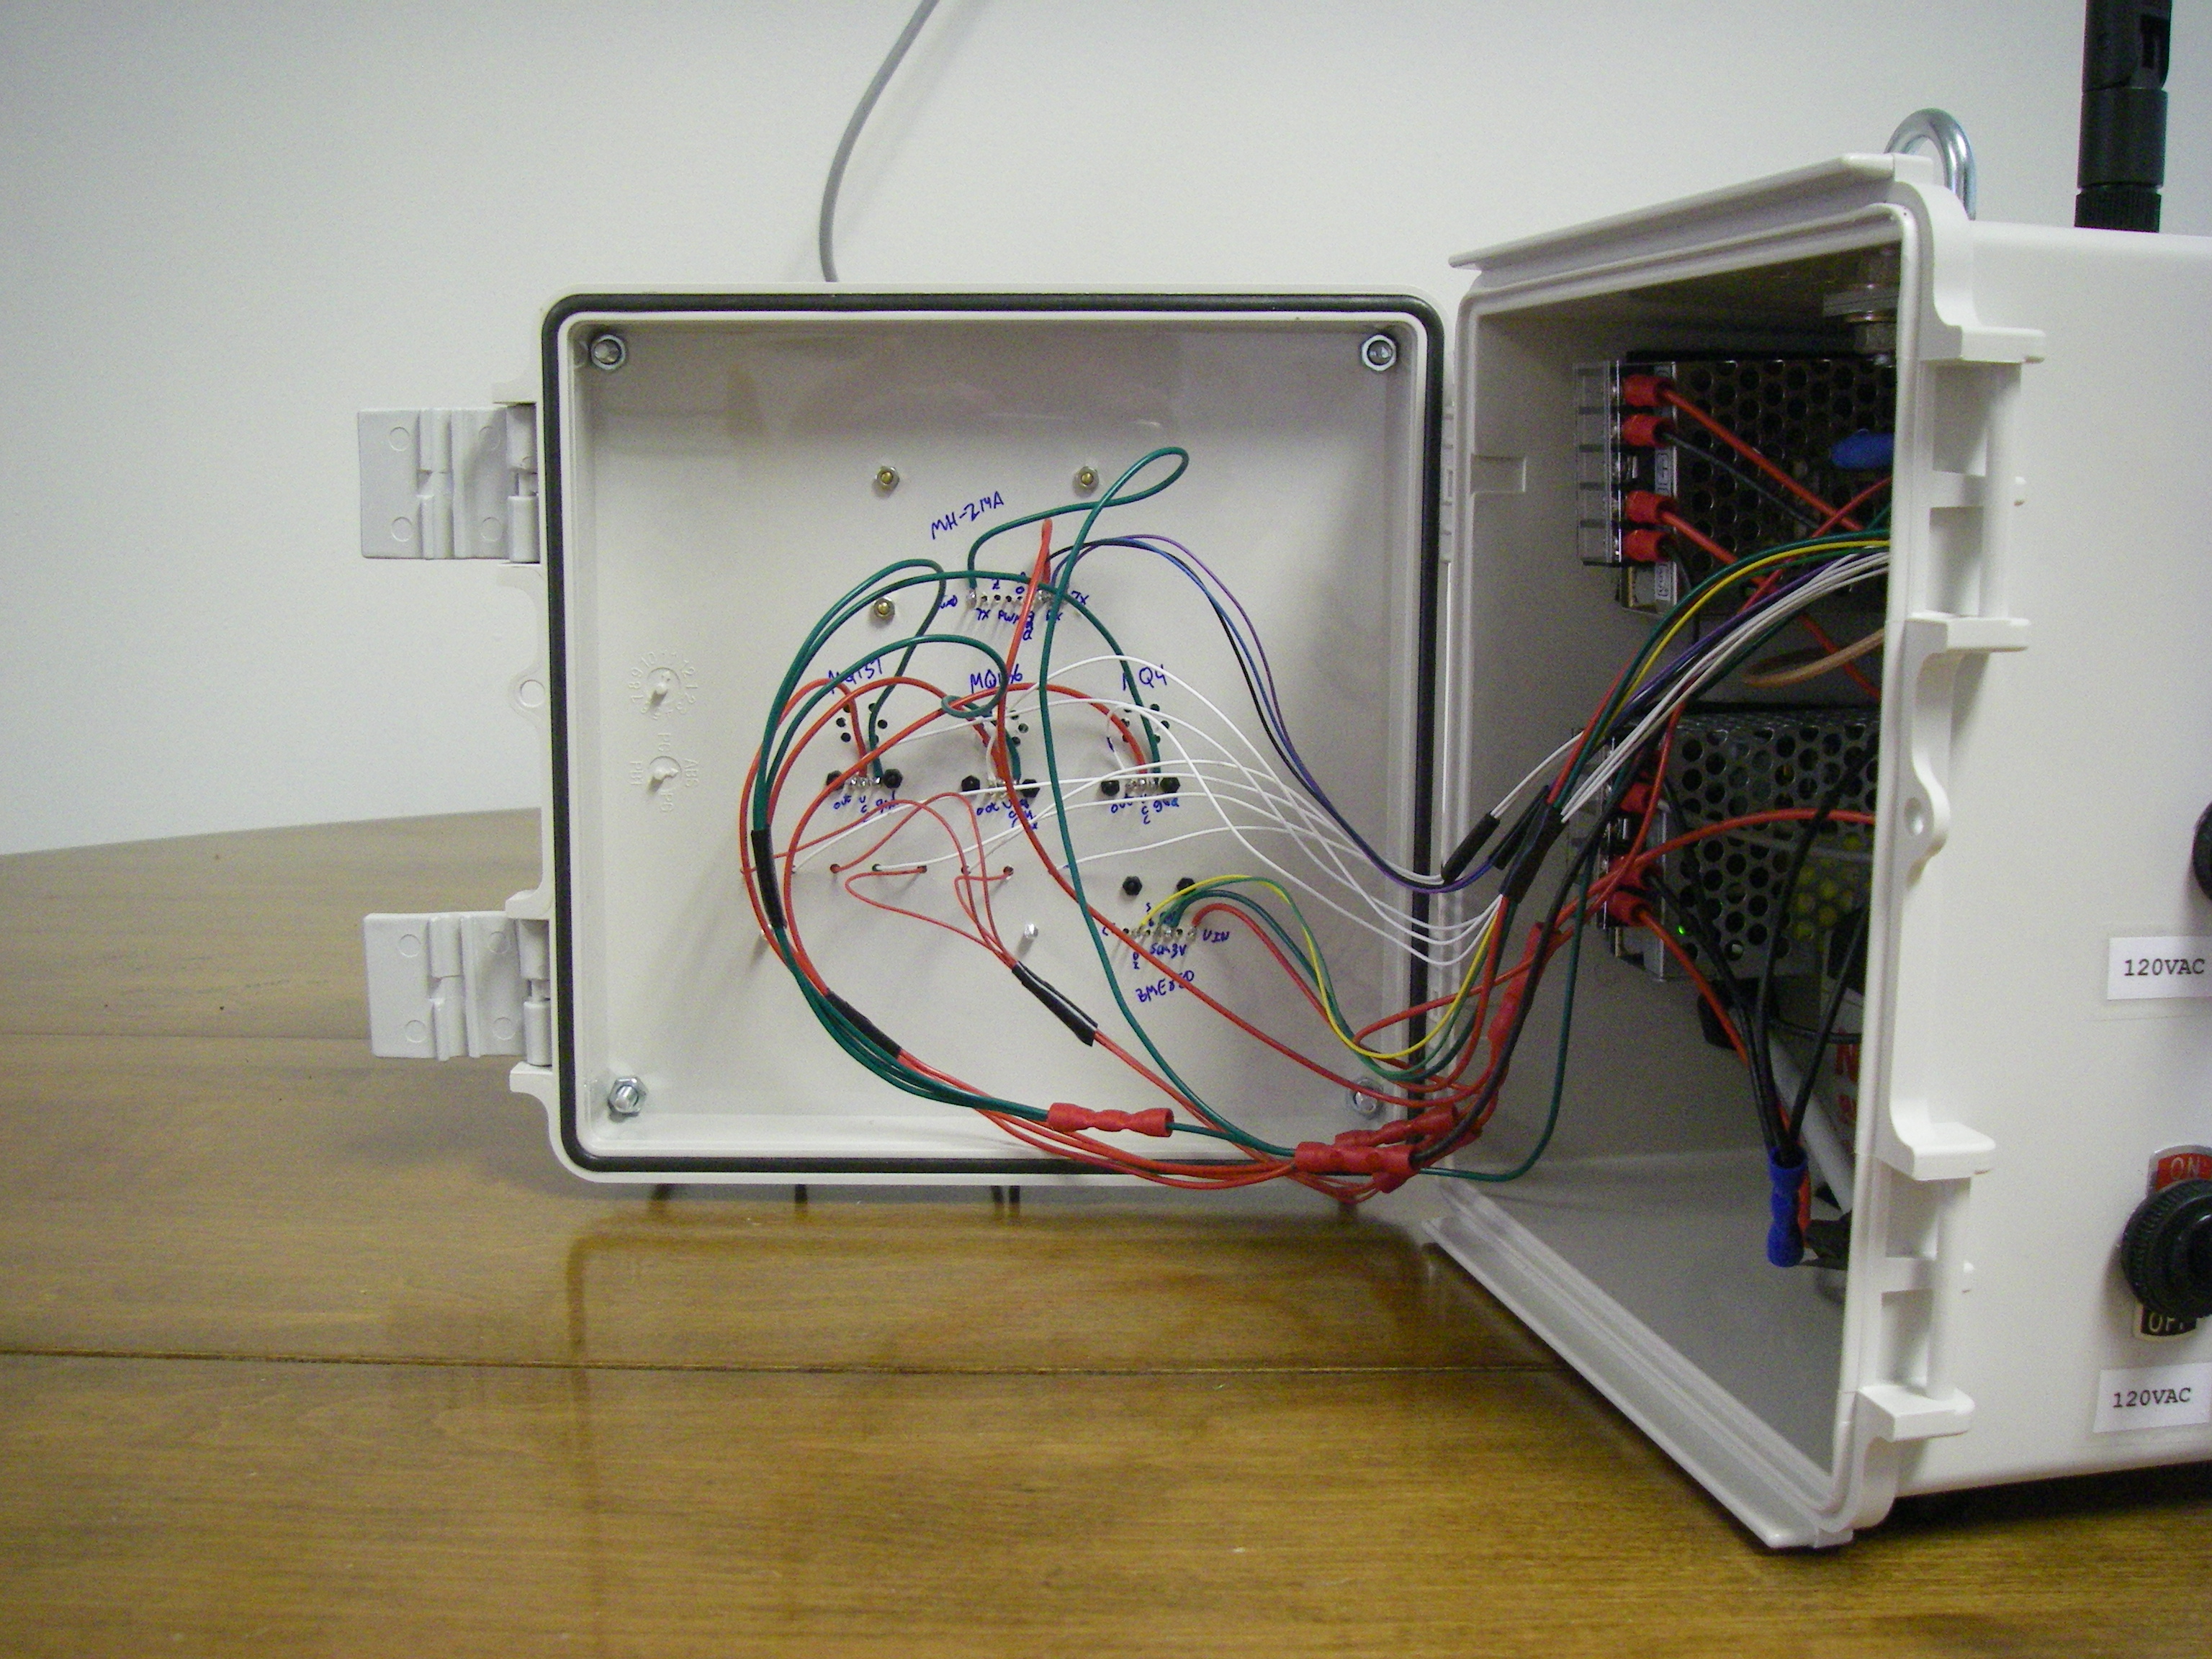
HardwareControllerThe controller is a Raspberry Pi 3 B+ running Raspbian Linux with a custom hat consisting of a Perma-Proto Hat board (Adafruit #2310) with two ADS1015 four channel A/D converter modules (Adafruit #1083) mounted on it. And, as long as I'm plugging Adafruit stuff, the BME680 module is an Adafruit #3660.The Raspberry Pi has a built-in WiFi adapter but I'm using a USB WiFi adapter with a detachable antenna so the antenna can be mounted on the case top SensorsThe gas sensors are mounted on the case door and are protected from projectiles and splashes by a sheet of polycarbonate. The environmental monitor is not designed to be exposed to weather. Most of the sensors are inexpensive MQ series resistive sensors sold by Zhengzhou Winsen Electronics Technology:
In addition there are four 10K thermistor inputs. Power SupplyThe power supply section consists of the following components:
The AC power line is protected with a 120VAC 0.5A fuse. The battery's connection to the intermediate power circuit is protected with a 12VDC 2A fuse. SwitchesThere are three switches:
To turn the environmental monitor on, turn on the AC Power, Battery, and Controller switches in sequence. Data collection will start automatically. To turn the environmental monitor off, first halt data collection, shut down Linux on the controller, and turn off the Controller, Battery, and AC Power switches in sequence. Sensor OperationThe MH-Z14A CO2 sensor connects to the controller's serial port and returns digital ppm values. The BME680 H20 sensor connects to the controller's I2C bus and returns digital temperature, air pressure, and relative humidity. From these values the water vapor concentration in ppm is calculated. The MQ sensors vary their resistance in response to the concentration of the gas for which they're designed. The sensors' manuals each contain a calibration curve and correction curves for temperature and relative humidity. An A/D converter reads the voltage drop across a sensor's resistor. From the voltage the sensor's resistance is calculated and from the resistance the gas concentration in ppm is calculated.The MQ-4 methane sensor's specification lists a minimum detection level of 300ppm. The calibration curves for all the MQ sensors were extended to 0ppm when the equations were derived. Methane concentrations from 0ppm to 300ppm may not be valid. The water vapor concentration is derived from the current temperature, air pressure, and relative humidity. The range shown below is from (20F, 1Atm, 20%) to (75F, 1Atm, 90%). Ranges:
DataThe data acquisition program, which is described more fully below, queries the sensors once per second. Values can be viewed in real-time by directly accessing the environmental monitor over the Internet. Five minute statistical summaries of the data are saved in the database.The data acquisition program does a considerable amount of processing of the raw acquired data. In order to calibrate the sensors once the environmental monitor is located on site, raw and some intermediate values are saved in the database along with the final values. The list of values saved in the database, as of this writing, is:
ConfigurationThe Hard'ack system is configured with text files. There are two primary configuration files that specify:
The environmental monitor's two primary configuration files, as of this writing, are:
The primary configuration files include other configuration files one of which, as of this writing, is: Data is organized two ways. In the controller it's organized by set and column. A set is a series of text files containing columns of numbers. A column is a column in a set. In the database data is primarily characterized by its position in the "location tree" described below. Controller Data Text File StructureUnless you're reading or writing Hard'ack configuration files you don't really need to know these details and can skip to the "Database Structure" section.Data text files are named prefix_YYYYMMDD_HHMMSS.txt. Each set is given a unique prefix. In the environmental monitor set prefixes are defined in the archive_config.txt file. YYYYMMDD_HHMMSS is the UTC date and time the file was created. The contents of data text files are tab delimited. The first column of each row is the UTC date and time the data in the subsequent columns was acquired. The format is "YYYY-MM-DD HH:MM:SS". Subsequent columns are columns numbered starting with zero and contain acquired data. Data text files contain no data context. There are no headers or titles to explain what each column contains. The gather_config.txt file has many lines beginning with "SetXColY" that contain the specifications for the values to be stored in the files created for set X and column Y. Set and column numbers start with zero but the first (leftmost) column in a data text file is the row's acquisition date and time and not a column. The second column in a data text file is column zero. Database StructureIn the database, data is primarily characterized by its position in a "location tree" of strict parent-child relationships. The location tree structure was created to model the interior of buildings. It doesn't work well outside that context. The layers of the location tree are:
A device may be a boiler, a water tank, a pump, an electric power line, or the interior environment. A ppoint may be a gas sensor, a thermistor, a voltage or current sensor, or a register in a smart sensor. A point may also be a value calculated from other points. An example of a point's designation on the location tree for the environmental monitor is:
Units are not part of the location tree but the point illustrated has the unit "ppm". Point data is stored as a series of database records each containing a statistical summary of the point's values for a period of time. The fields of a record are:
It is possible to store discrete samples in the database. In that case the first and last sample times will be the same and all values will be the sample value except standard deviation which will be zero. The environmental monitor samples data once per second and stores five minute statistical summaries in the database. If there are no acquisition problems then each database record is a summary of 300 samples. Hard'ack Project HistoryMany years ago Housing Vermont, a Burlington, Vermont based developer of affordable housing, asked me to develop a system to monitor the operation of the boiler rooms of various Housing Vermont buildings. I called the system "Hard'ack" which is a loose acronym of "Housing Vermont Data Acquisition" and the name of a popular ski hill in St. Albans, Vermont. Housing Vermont is no longer involved in Hard'ack development."Hard'ack Technology" is just a name I made up. Hard'ack HardwareThe Hard'ack programs run under both Windows and Linux but Linux is the intended platform. The following controllers have been put into production:
Hard'ack SoftwareThe Hard'ack system consists of a set of programs that run on the controller and another set of programs that run on an optional database server. The Hard'ack programs are written in the C language and run under both Windows and Linux.Hard'ack Controller SoftwareGatherThe gather program queries sensors and produces numbers that are stored in a series of tab-delimited files on the controller's equivalent of a hard disk drive. A minimal Hard'ack installation runs just the gather program. Sensor specifications are entered into a configuration file that can become quite elaborate.The gather program initially calculated temperatures from thermistors connected to Modbus A/D controllers. The program has since then evolved into a behemoth that can query a number of Modbus, BACnet, oBIX, serial, TCP/IP and I2C devices; do calculations on the results, and create statistical summaries of sampled data for a specified period. The following devices are supported:
ScatterThe optional scatter program reads the tab-delimited files produced by gather and does things to them including:
The environmental monitor writes statistical summaries to a PostgreSQL database. BeaconThe optional beacon program pings the database server once a minute and obtains the controller's public IP address on the Internet and the current password of the panel program, which is described next.PanelThe optional panel program is an old-fashioned cgi-bin program invoked by an HTTP server. The panel program accepts a single password and then renders sampled data in real-time. Data is presented on several pages as defined by the gather program's configuration file.Other Controller SoftwareLighttpdLighttpd is a lightweight HTTP server suitable for running on smaller controllers. It invokes panel to render the real-time display.OpenVPNRemote management and secure database access is provided by running an optional OpenVPN client on the controller. The client connects to an OpenVPN server on the Internet. The Hard'ack networking system is described later.Hard'ack Server SoftwareNexusNexus is a large cgi-bin program invoked by an HTTP server. Nexus is the Hard'ack system's web graphic user interface (GUI) to the database. Typical nexus operations are:
DispatchThe dispatch program is another cgi-bin program invoked by an HTTP server. Dispatch handles requests from beacon running on controllers and returns the controller's public IP address and panel password.SentinelThe Hard'ack system has a system of alerts to warn about out-of-range or error conditions. E-mails are sent in response to an alert. The sentinel program periodically scans the database for alert definitions and processes them.Other Server SoftwarePostgreSQLPostgreSQL is the database engine used by Hard'ack to store data.ApacheThe Apache HTTP server is used to invoke the nexus and dispatch cgi-bin programs.Hard'ack NetworkingA full Hard'ack system has four networking tasks:
There are many different ways to accomplish these tasks. My current setup relies on a Virtual Private Network (VPN) for tasks #2 through #4. A single server performs both database and web GUI functions. Making a server publicly available on the Internet (task #1) is relatively easy. It requires friendly Internet access with either an unchanging static IP address or an arrangement with a third party outfit like NoIP.com to manage a changeable dynamic IP address. If the server is directly connected to the front-line firewall then opening ports 80 (HTTP) and 443 (HTTPS) and forwarding them to the server is all that needs to be done. If there are layers of firewalls between the Internet and the server then ports 80 and 443 need to be opened and forwarded from layer to layer to reach the server. Making a controller publicly available on the Internet for maintenance and real-time panel access (tasks #3 and #4) are similarly easy if the Internet access is friendly. Opening port 22 (SSH) and port 443 (HTTPS) on the front-line firewall and forwarding the ports to the controller accomplishes these tasks. But you may not have control over the Internet access at some sites and the people who do have control of the front-line firewall may not want to open ports through it. A common solution is to create an encrypted Virtual Private Network (VPN) that bypasses the issue of site-side firewalls entirely. I use a Ubiquiti EdgeRouter as a VPN server. The VPN server is attached to my front-line firewall and port 1194 (OpenVPN) is opened and forwarded to it. The VPN server defines its own network that is independent of all other networks. A second network interface on the VPN server is the physical manifestation of the independent network and the database/web GUI server is connected to it. This puts the database/web GUI server behind two layers of firewalls: My front-line firewall and the VPN server. To accomplish task #1 the front-line firewall forwards ports 80 (HTTP) and 443 (HTTPS) to the VPN server and the VPN server then forwards the two ports to the database/web GUI server. When a controller starts up it creates a connection to the VPN server and establishes its presence on the independent network. The controller now has direct access to the database server accomplishing task #2. Anyone logged into the database/web GUI server has direct access to all the controllers and can log into them using the SSH protocol. This accomplishes task #3. Another way to access the controllers for maintenance is to install an OpenVPN client on one's travel computer and connect to the VPN. Task #4, making a controller's real-time panel publicly available on the Internet, is more intricate. To be secure the real-time panel must use the encrypted HTTPS protocol. The standard port for HTTPS is 443 but that port is being used by the web GUI server. A further complication is that there may be several controllers and a single public IP address. There are a few ways to do this. My solution is to use non-standard ports, a unique non-standard port for each controller. The unique port for each controller is forwarded by the front-end firewall to the VPN server. The VPN server then does Source Network Address Translation (NAT) to route the port's traffic to the controller over the VPN. This makes the VPN server a middleman between a user's workstation and the controller. Requests are sent from a user's workstation to the VPN server and relayed to the controller. Replies are sent from the controller to the VPN server and relayed to the user's workstation. Here's how it works in detail:
|